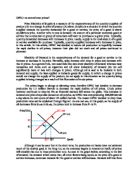
A shift along the demand curve
The second change is known as a shift along the demand curve; an example of a graph has been given right below:
A shift in the demand curve is when there is a change in an influencing factor. However, this is other then price, because the movement along the demand curve is influenced by the price. The shift in the demand curve can either be left or right, differing between the positive and the negative, as the quantity demanded increases or decreases at a given price. This is indicated by the satisfaction of the buyer’s opinion, if the product has a positive response, the quantity demanded at each price may go up, and vice versa, if the product has a negative response.
In this graph, the D1 shifts along the x-axis to create D2. This represents a shift to the right, a positive response; therefore buyers will continue to buy this at the previous price before. This also provokes an increase in demand; however the price is still the same.
Factors also contribute to the demand of a product, and changes in one or more of the factors cause shifts in the demand curve. These factors include:
- Customer preference (example: Ipod vs MP3 player)
- Prices of related goods (cheaper, non expensive)
- Complements ( increase in the price of a complement reduces demand)
- Income ( an increase in income shifts the demand curve)
- Number of buyers (population)
However, these don’t always stay in a positive shift in the demand curve. For example, if there is an expectation of a price change, the increase of the current demand may increase as consumers increase quantity they purchase the product in, however once the price is raised, the demand may decrease.
Ceteris paribus
A statement has been made to go along with the two changes in the demand called the certeris paribus, which translate to being equal. This states that one should only look at the two variables of demand and price. In order to form scientific laws, other factors contributing that could alter results are ruled out; therefore one can single out the effect of the independent variable.
Part B:
Market:
In marketing, the term market refers to the group of consumers or organizations that is interested in the product, has the resources to purchase the product and is permitted by the law to acquire the product. It is a place where both sellers and buyers meet.
Allocation of resources:
of how scarce , factors and producer’s are distributed among , and how scarce are apportioned among . Taking into consideration the accounting cost, economic cost and opportunity cost.
In the world of economics, the two most influential factors, which would be supply and demand, control not only the market but also the quantity of a good being produced. Therefore, yes, the market forces of demand and supply will always lead to the best allocation.
YES, THE MARKET DOES:
To understand the principle of the matter, in which one needs to prove that market does lead to the best allocation of resources, explaining “allocation of resources” is significant. The allocation of resources is described as a “distribution of productive assets among different uses.” Resource allocation arises as an issue because the resources of a society are in limited supply. It is difficult to choose among the competitive substitutes, as human wants are usually unlimited, we are greedy and always tend to desire more, choices often have alternative uses. Being the building blocks of economics, it is important to ask basic economic questions to reflect upon the best decisions for the community. Economic questions such as “what to produce”, “ How to produce it” and “whom to product it for”. Therefore this ties in to allocate resources to the best of its abilities, one needs to decide what will be more beneficial and useful to the community. An example of this if a product was needed by both a school and a technology company such as apple, the source would most likely go to schools, since education benefits the population and community and therefore is more supportive to people than an I pod.
A free market economy a market where the price of a good or service is determined by , rather than by governmental regulation. Considering that the demand and supply forces make up the quantity and price of a good, this gives the community freedom in which enables us to call it a free market. A free market contrasts with a , where price and quantity of the good (supply and demand) are controlled by government. Therefore, the government in a free market does not have the ability to decide what goods will be made for what price. This leaves the freedom for the demand to control the price, thus if a numerous amount of consumers consume the same product and continue to, the price will decrease but supply will increase because it is well demanded. There are both negative and positive aspects of the free market and to having the government not control the supply and demand, such as one is available too much more choices (The price mechanism) (example: different brands of cigarettes). However, there is a lack of merit goods including education, as the government provides this and more demerit goods (drugs).
Example of countries with a free market: USA, Europe, and Hong Kong.
Example of countries with the command economy: China, Soviet Union, North Korea.
The term of the “Invisible hand” references a concept described by Adam Smith in the 18th century. It is generally accepted by the world of economics as a means to explain the forces of a free market. Smith’s description of the invisible hand theory states, “individuals pursuing their own interest frequently promote the good of society than when he really intends to promote it.” According to the invisible hand theory, as we concentrate on our self interests, we generate a demand for goods that allows others to deliver those goods in the most efficient manner so that they may be able to receive reward from others and make a profit in doing so. The consumer then decides demand and supply, so the good is given in higher demand.
Another instance that leads to the best allocation of resources is a term called “ Price signal.” This is an indication signal for producers to increase supplies so that it can keep up with the consumer’s demands (Can also be demander’s that need to reduce their demand). An example of this would be linking back to the free price system, prices that tend to raise often emphasis a decrease of supply or an increase in demand; this also associates to the incentive function of the price mechanism. is created when a producer or consumer is motivated to change behavior. When an existing product gains popularity, and prices become higher, they are supplied more because they provide more revenue, which then leads to more profits.
It is necessary to have prices change and to eliminate surplus and deficits to have superlative allocation of resource. In order to eliminate surplus and deficit, prices have to change in order to reach a new equilibrium and therefore, the surplus is deleted. Price change also has this effect on the deficit. The price must work around what the community desires, and to seek consumer’s desires, therefore when a more of a good is being sold then supplied, income and outcome must be balanced through change of price to delete the deficit.
In conclusion to leading to optimal allocation of resources and how the market forces demand and supply, one of the leading contributing factors is how producers and consumers act in their own interest. Meaning that, if producer and consumers work together and that the consumers take control of the goods that should be in demand, producers can supply the resources needed to reach the equilibrium. Stating where the equilibrium meets decides on where the recourses should be used, so that one can supply a good that is asked for in demand then a good that is not. This creates a perfect harmonious relationship in which consumers decide the quantity of demand for the producers, as they decided what goods are needed.
NO, THE MARKET DOESN’T:
However there is an argument to which the market does not. In the world of economics, the two most influential factors, which would be supply and demand, won’t always lead to the optimal allocation of resources.
Reasons for market failing can occur in numerous ways, as the world is not completing ideal and therefore the government intervenes to some degree. Also, in the reality of the world, markets are not perfect and MSC is not always equal to MSB therefore market failure does occur. One of the reasons as to why it fails is because of under provision of merit goods and the overprovision of demerit goods. The under provision of merit goods when left on its own, only demerit goods would be left to rule. This would include examples such as alcohol and cigarettes verse goods we need such as education, hospitals to establish a balanced world. To discourage the demerit goods the government creates negative advertising, tax on the products or banes them from being used. Without the regulations of the government the market will commence failure. In example of the government regulating the community for one’s health would be the law stating that smoking should be prohibited in all in door areas, for the sake of non-smokers and the risk factors of second hand smoking.
The most significant reason as to why the market will not lead to the best allocation is because of the government’s intervention, which is necessary to aid the resource allocation. Firms usually thrive by providing what consumers desire and more cost effectively than their competitors. This is done through lower pricing, better quality and service of goods, however these firms need the government to affect the market in a positive leading way. The government sets legal and institutional frameworks for firms and markets to work in. Regulation needs to be determined to set proper rules to enforce the firms and markets in the right direction. Government influences the behavior or business and the constant economic activity. The government’s intervention also connects through the market in direct and indirect ways. In direct ways one can say there is acting as a supplier, through direct goods and services to the public as well as acting as a buyer, through competitive aid. While indirectly, the government participates in taxes and subsides, through changing the goods and services to match the quality of demand needed as well as regulation and influence.
In conclusion, the evidence for and against that the market forces of demand and supply will always lead to the best allocation has both positive and negative aspects to the yes and no. Overall, One can say that NO, the market cannot and will not always lead to the best allocation. Though having the consumers being able to decide the demand quantity and having the producers balancing and aiding to find where the goods go is a chance for more choices to be made, but demerit goods to be over provided. There is also the issue that the competitive forces of supply and demand will not produce quantities of goods where the prices reflect the marginal benefit of consumption, which would lead to allocative inefficiency. One can say that without the building blocks of the government, the market would crumble.