Table 1
Graph 1
This set of values can be modelled by using following quartic function:
where
Following graph presents the modelled function in comparison to the datapoints from Table 1 which are circled for clearer presentation.
Graph 2
The function drafted in Graph 2 follows the datapoints given obediently and no significant difference can be found.
Besides quartic function, also the following gaussian function can be used to model the datapoints.
where
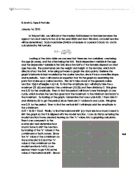
The following graph illustrates the difference between quartic function (black) and gaussian function (pink) with the datapoints given in Table 1.
Graph 3
The differences between the functions are rather minimal and most likely with excessive tweaking of the variables they could be made match each other almost perfectly. This familiriality can be explained by the close connection between quartic and gaussian functions. For the gaussian function is quartic function in which exponential function has been applied.
In order to see is it possible to use the quartic function as a model to predict the BMI of older ages than included in Table 1 lets take a look at the expanded version of Graph 3.
Graph 4
As we can see the quartic function would indicate that at the age of thirty, the mean BMI of American woman would be approximately 18. This would indicate that huge amount of American women would be anorectics which most likely is not the truth. From here we can deduce that quartic function is not a very viable way to model BMI of American women.