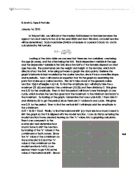
, or by the cosine function
as it is periodic and ondulating, which means it repeats a pattern as it goes up and down. Other functions can’t be used in this model as the information given can be reflected in other type of graphs. Finally, we can deduce that it will be a cosine function as the portion that we observe in tha graph doesn’t go through the origin (0,0), as the sine function would do.
After deducing which function type best fits the provided data, I used a GDC to test different forms of
through trial and error and found that the function
modeled the data closely, although a few values didn’t exactly fit the data.
We can observe that they curve in similar fashion, however, they are not identical. The first few points, for instance, before age 5, have higher x values than the cosine function. The same happens with the last few, after age 16.
This is the first raw model, but in order to discover a better model that fits much better the information , I continued searching cosine models by trial and error until I came up with a better function that reflected the information. This function is:
Both the original function
and
are graphed below.
We can see that these functions are very similar, however the new model is a bit more accurate, and falls slightly higher on the y-axis. It’s logivcal that the two would be similar as I altered certain values very slightly so that the function could fit better.
After discovering the model function, it can be applied to estimate certain values not included in the data.
We will use the model to estimate the BMI value of a 30 year old woman in the US at that time.
The graph below shows the estimation.
Using technology, after including the model cosine function of
, we can trace the graph to find the coordinates were age is at 30. So after doing this, we can see that the BMI of a 30 year old woman in the USA at this time is ≈ 16.6.
This value is considered to be low, as if we check the webpage from were the table of the information comes from, we can see that under 18.5 is considered to be underweight.
()
The model function, or at least a similar one, could perhaps also be applied to body mass index statistics for women in othr countries.
The table below provides the BMI for women of varying ages in France.
Source:
When graphed:
The model function
does not fit exactly over this data.
In order to make it fit, the function would need to be redefined in order to make the curve fit better. After using trial and error and manipulating the model function I came up with a new function that matched the information a bit better. It is graphed below:
The function that I came up with and that matches much better the data is:
. It is very similar to the model function of before, but I have altered the horizontal translation slightly so that it matches better.
LIMITATIONS
-Values for x and y can’t be negative as it is a real-life example.
-The model function for American women doesn’t fit with French women as bmi changes slightly.
-The correlation doesn’t make a perfect line so the function is not 100% accurate.