But will this ratio remain as we increase the power of the function? This will be proven by elevating the exponent of the formula by 1 each time so this can lead to a conjecture.
Testing variables for n
Procedure
Therefore, the ratio is given by the formula.
Graphing
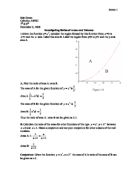
From the graphs we can observe that as the value of n keeps increasing the area between the curve and the x-axis gets narrower. By the other side, as n increases the area A increases too.
So as we can conclude the ratio of the areas increase proportionally to the value given to n. But what happens when the parameters of the area are changed? In this section of the investigation I will change the limits such as and and , etc.
Procedure
Area B
Area A
Graphing
For this section, the area of A was given by the inverse of the formula so that if is equal to B, is equal to A. Therefore, based in the results of the table, the conjecture remains as n:1.
The conjecture is true for the general case from and such that and for the following regions:
Area A: , , and the y-axis.
For example, when getting the area B from to with the function is necessary to use . So, to find the area of the curve to the y-axis (area A) it is necessary to alter the limits so that they are and . So as and , and .
Until now the investigation has been working with ratios of areas; but what happens when dealing with volumes? In this final section, I will search for a general formula for the ratios of volumes of revolution generated by the regions A and B when they are rotated around the x-axis and the y-axis respectively.
The volume of x is given by the formula . So the formula will be used to get the area of .
=
Now, I will proceed to find the volume of revolution of from and .
=
As we can see, the area under the curve rotates around the x-axis.
Now, using the same procedure I will find the volume of revolution of within the same parameters.
=
As we can observe, comparing this graph with the graph of , the volume gets more narrow.
Now I will get the volume of revolution of .
=
As stated in the previous graph, we can see here more clearly how the center of the volume is getting narrower as the power of the function increase.
Therefore a conjecture can be made, based in the results given of each calculation of the volumes, as in every increase of power in n the denominator increases by 2. The general formula for volumes of revolution in limits to is:
But will this conjecture apply for all volumes? Now the limits are going to be changed from to , and from to .
Now, for from to :
Now, using the same procedure I will find the volume of revolution of for the same limits:
Now in this graph we can observe how it goes from to .
Now I will continue with .
From the graphs it can be concluded that as the function elevates its power, the volume closes more.
Now the limits will be from to .
Therefore, a general conjecture for the volumes of revolution of x would be:
Let’s prove the conjecture with a random example:
So, by the use of the formula the result would be this:
And by the using of the conjecture, the result gives this:
Therefore, the conjecture for volumes of revolution generated by region B to the x-axis is correct.
Now, is there a general formula for ratios of volumes of revolution generated by region A to the y-axis?
Foe the development of this conjecture, I will use the same examples used before to find a conjecture for the x-axis.
So, as we can see the area now rotates around the y-axis, as the region A is the one that it is spinning now.
As it may be observed, as the power of the function is increased, the volume gets wider. This is opposed to the volume of revolution formed to the x-axis, which gets narrower when the exponent increases. Those two situations are connected, as when the volume of y gets wider, limits the space of the other volume and vice versa.
Now, the limits of the examples will be changed.
,
All graphs were developed on Graph software, version 4.3.
Plotting for volumes of revolution was graphed on Winplot.