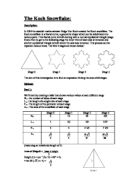
Number of sides of the Koch Snowflake
From the table above we can see that there is an increase in the number of sides at every stage by a factor of 4. At every succeeding stage, the number of sides is 4 times the number of sides in the preceding stage. This means that the number of sides of the snowflake follow a geometric sequence. With the help of this concept of geometric progression, we can formulate a general formula for the number of the sides of the snowflake. The general formula for a geometric progression is as follows –
Un = U0*Rn
Where R = ratio between two successive terms, U0 = 1st term, and Un = nth term of the sequence. Substituting Un with Nn can give us the general formula for the number of sides of the snowflake which is –
Nn = N0*Rn
= 3*4n
Since, R = 4 and N0 = 3 (as found out from the table above).
Verification –
For n = 0
N0 = 3*40 = 3*1 = 3
For n = 1
N1 = 3*41 = 3*4 = 12
For n = 2
N2 = 3*42 = 3*16 = 48
For n = 3
N3 = 3*43 = 3*64 = 192
Thus, the generalizations for Nn made above apply consistently to the sets of values given in the table and also satisfy the graph made above.
Length of one side of the Koch Snowflake
From the table above we can observe that at every succeeding stage, the length of one side is 1/3rd the length of one side of the preceding stage. This means that there is again a geometric sequence that can be seen. Keeping the formula for geometric progression (Un = U0*Rn) in mind, a general formula can be formed for the length of one side of the koch snowflake –
Ln = L0*Rn
= 1*(1/3)n
= (1/3)n
Since L0 = 1, and R = (1/3) (as seen from the table above)
Verification –
For n = 0
L0 = (1/3)0 = 1/1 = 1
For n = 1
L1 = (1/3)1 = 1/3 = 0.333333
For n = 2
L2 = (1/3)2 = 1/9 = 0.111111
For n = 3
L3 = (1/3)3 = 1/27 = 0.037037
Thus, the generalizations for Ln made above apply consistently to sets of values produced in the table and it also satisfies the graph above.
Perimeter of the Koch Snowflake
To find the perimeter of any polygon, the easiest and the most convenient method is to multiply the number of the sides of the given polygon with the length of one side as the snowflake is a sort of a regular polygon. The same is the case of the koch snowflake. If we multiply the number of sides (Nn) with the length of one side (Ln), we would obtain the perimeter of the snowflake at every stage. With the help of this concept, we arrive at deriving a general formula to find the perimeter which is –
Nn*Ln
= 3*4n*(1/3)n
= 3*(4/3)n
Now here, we can again observe that the perimeter can also be found out using the method of geometric progression. The perimeter of the koch snowflake, like its number of sides (Nn) and the the length if one side (Ln), follows a geometric pattern which can be written in the following way –
Pn = P0*Rn
= 3*(4/3)n
Since, P0 = 3 and R = 4/3 (as can be seen from the table above)
Verification –
For n = 0
P0 = 3*(4/3)0 = 3*1 = 3
For n = 1
P1 = 3*(4/3)1 = 4*1 = 4
For n = 2
P2 = 3*(4/3)2 = 16/3 = 5.333333
For n = 3
P3 = 3*(4/3)3 = 64/9 = 7.111111
Thus, the generalizations for Pn made above apply consistently to sets of values produced in the table and also verify the graph.
Area of the Koch Snowflake
The area of any equilateral triangle is given by the formula (√3/4)*s2, where s is the length of a side of the equilateral triangle. As we can see from the table, the initial areas of the snowflake at stage 0, i.e., A0 = √3/4 = 0.43301. At every succeeding stage, a certain number of additional triangles add to the previous figure of the snowflake, increasing the area. For example,
At stage 1,
Area of the snowflake = Area of the snowflake in previous stage 0 + Area of additional triangles added in stage1
Thus, the area of additional triangles at each stage can found out by multiplying the area of one additional triangle with the total number of additional triangles. At every succeeding stage, a triangle is added on every side of the snowflake (as explained in the introduction of my portfolio). Thus, the number of additional triangles added at every stage is equal to the number of sides (Nn) of the snowflake in the preceding stage. Hence, we can find a general formula for the number of additional triangles, which is -
3*4n-1
This is because the number of sides is given by the formula 3*4n.
Now the area of each additional triangle will be (√3/4)*s2, where s is the length of one side of the equilateral additional triangle. The length of one side at nth stage, as shown above is (1/3)n. Thus, the area of each additional triangle will be –
= (√3/4)*[(1/3)n]2
= (√3/4)*(1/32n)
= (√3/4)/32n
Hence, the area of additional triangles at each stage is given by –
= (√3/4)*3*4n-1/32n
= (√3*3*32n)*(4-1*4n-1)
= 3(3/2)-2n*4n-2
Now, if the area of the snowflake in the present stage is An, then the area of the snowflake in the preceding can be written as An-1. Thus, now I can finally arrive at the general formula for the area of the koch snowflake, which is –
An = An-1 + (3(3/2)-2n*4n-2)
Verification –
For n = 1
A1 = A0 + (3(3/2) -2*1*4(1 -2))
= (√3/4) + (3(-1/2)*4 -1)
= 0.433013 + 1/(√3*4)
= 0.433013 + 0.144347
= 0.577350
For n = 2
A2 = A1 + (3(3/2) -2*2*4(2 -2))
= 0.57735 + (3(-5/2)*1)
= 0.57735 + 1/(3(5/2))
= 0.57735 + 0.06415
= 0.641500
For n = 3
A3 = A2 + (3(3/2) -2*3*4(3 -2))
= 0.6415 + (3( -9/2)*4)
= 0.6415 + 4/(3(9/2))
= 0.6415 + 0.028511
= 0.670011
Thus, the generalizations for An made above apply consistently to sets of values produced in the table except for A0 because if I put n = 0, then the formula of area will not satisfy the graph. Hence, the generalizations that I have made is not true for n=0.
Q4. Investigate what happens at n = 4. Use your conjectures from step 3 to obtain values for N4, L4, P4, and A4. Now draw a large diagram of one “side” (that is, one side of the original triangle that has been transformed) of the fractal at stage 4 and clearly verify your predictions.
Now, after I have made the generalizations, I will try to use those general formulas made and verified in Q3. to investigate what happens at when n = 4.
N4 = 3*44
= 3*256
= 768
L4 = (1/3)4
= 1/81
= 0.012346
P4 = 3*(4/3)4
= 256/27
= 9.481481
A4 = A3 + (3(3/2) -2*4*4(4-2))
= 0.670011 + (3( -13/2)*42)
= 0.670011 + 16/3(13/2)
= 0.670011 + 0.012672
= 0.682683
Thus, the generalizations I had made in question 3 have been proved to satisfy the values at stage 4. Below is a large diagram of one “side” of the fractal at stage 4.
Q5. Using the relationship between successive terms of Nn, Ln, Pn, and An, use a spreadsheet or similar software to find the values of each up to a value for n where An+1 equals An to six places of decimals. What is the value of n at this point?
Using Microsoft Excel as my spreadsheet, I have worked out the value for n where An+1 = An to six places of decimals (The values were worked out till the seven places of decimals and were rounded off to six places of decimals).
The value of n at which An+1 = An is found out to be 16. Thus, at this value A16 = A16+1, or A16 = A17 (to six places of decimals). Below is given a graph to show how the difference in values of An and An+1 decreases and they come closer and become equal at n=16.
Q6. Explain what happens to the perimeter and area as n gets very large. What conclusion can you make about the area as n → ∞? Comment on your results.
As n increases, we should observe that the values of the length of the perimeter and the area of the Koch snowflake increases as well but the extent to which it increases is not defined.
In the case of the length of the perimeter of the snowflake, the value of successive terms increases by a ratio of 4/3. Thus, as n tends to infinity the perimeter of the snowflake will also reach infinity in due course.
In case of the area of the snowflake, the general formula of area is given by-
An = An-1 + (√3/4)*3*4n-1/32n
= An-1 + A0*3*4n-1/9n
Multiplying A0*3*4n-1/9n by 3*(1/3), we get
= An-1 + A0*(4/9)n-1/3
Now in case of n=1
A1 = A0 + A0*(4/9)1-1/3
= A0[1+{(1/3)*(4/9)0}]
When n=2
A2 = A0[1+{(1/3)*(4/9)0 + (1/3)*(4/9)1}]
= A0[1+(1/3)*{1+(4/9)0+(4/9)1}]
Thus,
An = A0[1+(1/3)*{1+(4/9)0+(4/9)1+…(4/9)n-1}]
Since, the values inside the curly brackets form a geometric progression thus as n → ∞, we can use the formula –
S∞ = U1/(1-R)
Where U1 = first term, and R = ratio between two successive terms.
Hence,
as n→∞; An = A0[1+(1/3)*{1/(1-(4/9))}]
= (8/5)*A0
=1.6*A0
Hence, we come to a great conclusion that the area of the Koch snowflake is actually 60% more than that of the area of the original triangle.
Finally, I come to a great conclusion that as n → ∞, the Koch snowflake has infinite perimeter but finite area.
Below are two graphs to visualize the concept of infinite perimeter and finite area.
Q7. Using your general expression for An and the iterative relationship between An+1 and An already established in step 1 above, prove the general expression for An by induction.
The general formula for the area of the Koch snowflake is –
An = An-1 + (3(3/2)-2n*4n-2)
The formula for area at n+1th stage will be –
An+1 = An + (3(3/2)-2(n+1)*4(n+1)-2) ---------[1]
= An + (3(3/2)-2n-2*4n-1)
Now, let the number of additional triangles at each stage be Un.
Thus, the general formula for area becomes –
An = An-1 + Un
Let it be true for n = k.
Therefore, Ak = Ak-1 + Uk
To be proved for n = k+1
Therefore, Ak+1 = Ak + Uk+1
RHS
= Ak + Uk+1
From equation 1, we get
= Ak + (3(3/2)-2(n+1)*4(n+1)-2)
= Ak + (3(3/2)-2n-2*4n-1) = LHS
Thus, I have proved my general formula for the area of the Koch snowflake through induction.
CONCLUSION
Now that I have finished this extensively researched portfolio, I have actually got inspired to know more about this project of mine and I am sure that you will also, after reading my portfolio, get the surge to know more about the Koch snowflake. After finishing this portfolio I was so inspired that I searched on the internet for figures similar to the Koch Snowflake and have found several figures such as the Koch Antisnowflake, the Exterior Snowflake, the Pentaflake and the Sierpinski Curve. Finally, I hope that you like my portfolio and enjoy reading it.
Stages in Koch Antisnowflake
Some beautiful tillings can be made with iterations towards the Koch Snowflake.
Some beautiful modifications of the Koch Snowflake involving the constituent triangles with filled-in triangles inscribed, rotated at some angles.
An extraordinary Koch Snowflake created in LOGO.
Koch Snowflake – Silbury Hill, England
A Beauty Indeed!
REFERENCES:-
http://www.nonoscience.info/2006/08/28/the-koch-curve-and-visual-resolution - 12/7/2007
http://www.mathworld.wolfram.com/KochSnowflake.html - 12/7/2007
http://ecademy.agnesscott.edu/~lriddle/ifs/ksnow/ksnow.htm - 20/7/2007
http://www.math.ubc.ca/~cass/courses/m308-05b/projects/fung/page.html - 20/7/2007
http://math.arizona.edu/~caine/chaos.html - 25/7/2007
http://mathworld.wolfram.com/KochAntisnowflake.html - 30/7/2007
http://jeffreymunro.com/amazingpics/index_old.php?showimage=318 - 1/8/2007
http://www.seasip.demon.co.uk/Unix/Joyce/screens.html - 1/8/2007