Hange of sign, Newton-Raphson and the rearrangement method and are going to use them to find roots of different equations, and hence
INTRODUCTION For my investigation, I will analyse the use three methods which are called the: change of sign, Newton-Raphson and the rearrangement method and are going to use them to find roots of different equations, and hence compare the merits and flaws of the methods with each other. I will analyse which is the best in terms of factors such as a speed of convergence and ease of use with available software and hardware.cocb 1. For Change of sign method (Decimal search) I use these equations: 2. For Newton-Raphson method (Fixed point iteration) I use these equations: -3ex +2x3+6=0 x3-2x2-2x+3=0 3. For Rearranging f(x) = 0 in the form x = g(x), I use these equations: In my course work, I will use computer (hardware) and Autograph (plot the graph), and Microsoft Excel (spreadsheet), Microsoft Word. Change of sign method: This method finds the roots of an equation by looking at the points where the graph crosses x axis. In these case the value of f(x) change sign from positive to negative or vice versa. And the root must be some where between two values that change. For this equation: Function . I am going to use the decimal search. Check the shape of the graph This is quadratic equation a = 6, b = 0, c = -4 D = b2-4ac = 0)2- 4x6x(-4) = 96>0 the graph has 2 turning points. As the graph shows there are three roots. I calculated each of the f(x) values in

Arrative and videogames: A discussion of the theories of Jasper Juul.
Narrative and videogames: A discussion of the theories of Jasper Juul By J.D. van den Ham Games and narrative The reasons why games should not be seen as narrative according to Juul (e.g. that there is no pre-fixed sequence of event and that every game session is different, the gamer being an active participant in the action, whereas in movies there is only one fixed sequence of events which the viewer can experience ) can sometimes be seen as formal rather than structural. He only sees narrative in the traditional sense, denying the use of new, yet to be explored narrative forms. According to Juul, most games have a story, for example in the manual or in the intro-sequence, placing the player's playing in the context of a larger story (the BACK-STORY) and/or creating an ideal story that the player has to realise. A goal or ideal sequence of events the player has to achieve to successfully end the game. But the actual playing is not the ideal sequence of events. Only a fraction of the play session actually follow the ideal path, but some games do succeed in presenting a fixed sequence of events the player can retell afterwards. Games do share some traits with narratives; for example quest structures, the use of protagonists and game sessions are predominantly experienced linearly. This ignores the player's experience of being an active participant. The experience is so
TILINTARKASTUS - STANDARDIEN VAI INFORMAATION TOTEUTTAJA?
TILINTARKASTUS - STANDARDIEN VAI INFORMAATION TOTEUTTAJA? Oikeustieteellinen tiedekunta Kauppaoikeus, syventävät opinnot Projekti "Globaali yhtiö- ja kilpailuoikeus - mahdollisuudet ja riskit" Ryhmätyö Tiina Mikkola Perttu Pohjola Jukka Uusitalo Teemu Vartiainen SISÄLTÖ SISÄLTÖ I LÄHTEET III LYHENTEET VI . JOHDANTO 1 2. TILINTARKASTUKSEN KULKU 2 3. TILINTARKASTAJAN KELPOISUUS JA RIIPPUMATTOMUUS 2 4. TILINTARKASTUKSEN SÄÄNTELY 4 4.1 Tilintarkastussuositusten alkuperä 4 4.2 Tilintarkastussuositusten perusperiaatteet 5 4.3 Tilintarkastuksen tavoitteet ja yleiset periaatteet 5 4.4 Dokumentointi 6 4.5 Väärinkäytökset ja virheet 7 4.6 Tilintarkastustyön suunnittelu 8 4.7 Olennaisuus 8 4.8 Tilintarkastusevidenssi 9 5. HYVÄ TILINTARKASTUSTAPA 9 6. INFORMAATION TARVE 10 6.1 Tilintarkastusinformaation edellytykset 11 6.2 Tilintarkastuksen tuottamat hyödyt 12 6.3 Tilintarkastuksen informaatio ja sen arvo 12 6.4 Tilintarkastusinformaatioon liittyvät riskit 13 7. TILINTARKASTUSKERTOMUKSESTA 13 7.1 Yleistä 13 7.2 Kertomuksen sisältö 14 7.2.1 TilintL 19 §:n 1 momentin edellyttämä informaatio 14 7.2.2 TilintL 19 §:n 2 ja 3 momentin vaatimukset 15 7.3 EU-säädösten vaikutukset tilintarkastuskertomukseen 16 7.4 Tilintarkastuskertomuksen informaatioarvosta 18 8. TILINTARKASTUSLAKITYÖRYHMÄN EHDOTUS TILINTARKASTUKSEN
Determination of moment of inertia of a uniform rectangular bar and a connecting rod using the trifilar suspension, and by swinging the connecting rod as a compound pendulum.
The Trifilar Suspension Tutor : Dr. Yan Name : Manilka Abeysuriya Course : Aeronautical Engineering Group : A - 1 Date : 27 / 01 / 2003 Title : Determination of moment of inertia of a uniform rectangular bar and a connecting rod using the trifilar suspension, and by swinging the connecting rod as a compound pendulum. Introduction : Moment of Inertia can be described as a measure of "unwillingness to change the current motion" of a certain body of mass. In the experiment, the main objective is to find the moment of inertia of a uniform body and an irregular shaped body. Toward achieving this First the center of mass of the bar and the connecting rod was found by balancing them on a knife-edge. Then the bar was placed on the trifilar suspension which is a circular platform suspended by three equally spaced wires of equal length, such that the center of mass of the rod is over the center of the circular platform. Then the whole system is given a small angular displacement, and the periodic time for the oscillations is determined by measuring the time taken for 20 oscillations. By using the equation 1 the moment of inertia of the bar about the axis through its center of mass can be calculated. The same procedure is followed for the connecting rod and its moment of inertia about the axis passing through its center of mass was found.
The trifilar suspension is used to determine the moments of inertia of a body about an axis passing through its mass center.
Introduction The trifilar suspension is used to determine the moments of inertia of a body about an axis passing through its mass center. The apparatus consists of a circular platform suspended by three equi-spaced wires of equal length. The body under consideration is placed with its mass centre exactly in the middle of the circular platform. The platform is given a small circular displacement about the vertical axis through its center, and is released. The periodic time of the subsequent motion is obtained by measuring the time taken to complete a definite number of oscillations. Then from the formula the moment of inertia of the body can be calculated. In Addition the moment of inertia of a connecting rod was found. The apparatus was a knife edge to suspend the rod and record the oscillations. This was the second part of the experiment. T=2? L I 0+I r2g M0+M Where L=length of suspension wires. r=radius from center to attachment points of the platform. I0=Moment of inertia of the platform. M0=Mass of platform I=Moment of inertia of body M=Mass of body g=Acceleration due to gravity Results Mass of bar .95 kg Mass of rod .85 kg period (s) Platform .73 Platform with the bar 2.14 Platform with the rod 2.99 Knife edge wide side down length (m) 0.238 period (s) .09 wide side up length (m) 0.098 period (s) 0.97 Theoretical moment of
Logistics equation. This coursework relates to an investigation and description of the systems behavior adopted by 1-D attractors typified by the logistic equation (the version to use is given below, in its difference equation form).
I-D Attractors - A Systems Description This coursework relates to an investigation and description of the systems behavior adopted by 1-D attractors typified by the logistic equation (the version to use is given below, in its difference equation form). The logistic equation: PN+1 = PN + kPN(1-PN). The coursework comprises an appreciation of data representation and its visualization, plus an indication of the equations use in engineering. Introduction The task we've been given is to investigate the behavior of 1-D attractors produced by the logistic equation: PN+1 = PN + kPN(1-PN). The way we have set out to do this coursework is by simulating the behavior of the equation by using an Excel spreadsheet model, and then using this to plot graphs. We plotted 40 graphs for values of k within the range of 0.5 - 3.0, with the interval of 0.0625. We believe this has given us a big enough range of graphs to show the varying behavior of the equation, with different values of k. We have then split the graphs into categories depending on the characteristics that they have shown. We also observed different steady states of the value PN for different values of k, and then plotted a graph with these results to show the overall system behavior. After having plotted all of these graphs, we observed that the system behavior shows bifurcation. This is when the steady states that we

In this investigation I have been asked to find out how many squares would be needed to make up a certain pattern accorting to its sequence.
In this experiment I am going to require the following: A calculator A pencil A pen Variety of sources of information Paper Ruler In this investigation I have been asked to find out how many squares would be needed to make up a certain pattern according to its sequence. The pattern is shown on the front page. In this investigation I hope to find a formula which could be used to find out the number of squares needed to build the pattern at any sequential position. Firstly I will break the problem down into simple steps to begin with and go into more detail to explain my solutions. I will illustrate fully any methods I should use and explain how I applied them to this certain problem. I will firstly carry out this experiment on a 2D pattern and then extend my investigation to 3D. The Number of Squares in Each Sequence I have achieved the following information by drawing out the pattern and extending upon it. Seq. no. 1 2 3 4 5 6 7 8 No. Of cubes 1 5 13 25 41 61 85 113 I am going to use this next method to see if I can work out some sort of pattern: Sequence Calculations Answer =1 1 2 2(1)+3 5 3 2(1+3)+5 13 4 2(1+3+5)+7 25 5 2(1+3+5+7)+9 41 6 2(1+3+5+7+9)+11 61 7 2(1+3+5+7+9+11)+13 85 8 2(1+3+5+7+9+11+13)+15 113 9 2(1+3+5+7+9+11+13+15) +17 145 What I am doing above is shown with the aid of a diagram below; If we take sequence 3:
Show how a Stratigraphical Sequence can be Deduced. How can Fossils be Used to Tell the Relative Age
Show how a Stratigraphical Sequence can be Deduced. How can Fossils be Used to Tell the Relative Age "Stratigraphy is the key to understanding the Earths crust and it's materials, structure and past life." "Within geology the study of time is the study of Stratigraphy." The earth's crust consists of bodies of rocks that can be divided into two groups: layered and unlayered. Layered rock bodies are described as stratified and unlayered are described as massive. The most common example of stratified rocks are sedimentary rocks. These have been built up by layer upon layer of sediments, some of which will be vastly similar and in some cases will have changed in character rapidly. Three basic principles must be recognised before a stratified rock sequence can be analysed. Firstly we must accept superposition that states that when a layer of rock was forming the layer beneath it was older. Secondly we must assume originalhorizontality,the idea that layers of rock were originally deposited horizontally and finally original lateralcontinuity. This means the layers of rock extend laterally until physically constrained in some way; this may be a shoreline or an upstanding relief feature. These principles allow a rock sequence to be seen as a record of geological events over time, with the oldest rocks representing the most ancient events at the bottom of the sequence.

In this investigation I have been asked to find out how many squareswould be needed to make up a certain pattern according to its sequence.
Plan of Investigation In this experiment I am going to require the following: A calculator A pencil A pen Variety of sources of information Paper Ruler In this investigation I have been asked to find out how many squares would be needed to make up a certain pattern according to its sequence. The pattern is shown on the front page. In this investigation I hope to find a formula which could be used to find out the number of squares needed to build the pattern at any sequencial position. Firstly I will break the problem down into simple steps to begin with and go into more detail to explain my solutions. I will illustrate fully any methods I should use and explain how I applied them to this certain problem. I will firstly carry out this experiment on a 2D pattern and then extend my investigation to 3D. The Number of Squares in Each Sequence I have achieved the following information by drawing out the pattern and extending upon it. Seq. no. 1 2 3 4 5 6 7 8 No. Of cubes 1 5 13 25 41 61 85 113 I am going to use this next method to see if I can work out some sort of pattern: Sequence Calculations Answer =1 1 2 2(1)+3 5 3 2(1+3)+5 13 4 2(1+3+5)+7 25 5 2(1+3+5+7)+9 41 6 2(1+3+5+7+9)+11 61 7 2(1+3+5+7+9+11)+13 85 8 2(1+3+5+7+9+11+13)+15 113 9 2(1+3+5+7+9+11+13+15) +17 145 What I am doing above is shown with the aid of a diagram below; If we
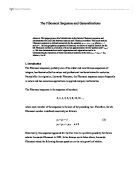
The Fibonacci Sequence and Generalizations
The Fibonacci Sequence and Generalizations Abstract: This paper gives a brief introduction to the famous Fibonacci sequence and demonstrates the close link between matrices and Fibonacci numbers. The much-studied Fibonacci sequence is defined recursively by the equation yk+2 = yk+1 + yk, where y1 = 1 and y2=1. By using algebraic properties of matrices, we derive an explicit formula for the kth Fibonacci number as a function of k and an approximation for the "golden ratio" yk+1 / yk. We also demonstrate how useful eigenvectors and eigenvalues can be in understanding the dynamics of linear recurrence relations of the form yk+2 = ayk+1 + byk where a, b ? R. I. Introduction The Fibonacci sequence, probably one of the oldest and most famous sequences of integers, has fascinated both amateur and professional mathematicians for centuries. Named after its originator, Leonardo Fibonacci, the Fibonacci sequence occurs frequently in nature and has numerous applications in applied and pure mathematics. The Fibonacci sequence is the sequence of numbers: 0, 1, 1, 2, 3, 5, 8, 13, 21..., where each member of the sequence is the sum of the preceding two. Therefore, the nth Fibonacci number is defined recursively as follows: y1 = y2 = 1 (1) yn = yn-1 + yn-2 n ? 3 Historically, this sequence appeared for the first time in