Qualitative Variable – Gender
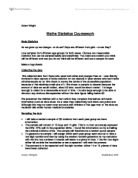
Gender was chosen as my qualitative variable because gender is categorized in one of two categories: male or female. This qualitative variable was categorized as 1 for male and 2 for female. When setting up the frequency table, the gender column in the predetermined data set was copied into a separate Excel worksheet. Since there are two categories (1 and 2), the bin range was set at 1 and 2. Once the frequency table was created, I substituted male for the number 1 and female for the number 2. See below:
This was also charted to give visual meaning. Sometimes a graph can help someone realize just how much more of one thing there is than the other. In this case, both the frequency table and chart indicate that there are substantially more females than male being evaluated. See chart below:
Measures of central tendency are numeric in nature; however, there is one method that can be used when the variable is qualitative. This method is called mode. Mode refers to the value that occurs most often in a data set (Bluman, 2008, p. 109). In this case, females occur more than males which tells me that the analysis of job satisfaction will be based mainly on a female’s opinion. A measure of variation does not apply because these are categories not numbers which can be ranked. See the chart for Excel calculations below for the mode:
Quantitative Variable – Overall Job Satisfaction
I chose the overall column because it was the first column with values that could be ordered or ranked. When setting up this data to be analyzed by Excel’s data analysis program, I first copied the overall column to a new worksheet. Since the values are numerical and can be ordered, I needed to setup how many groups I wanted in my histogram. After determining that I wanted 5 groups, I needed to calculate the range which turned out to be 3.9 (maximum – minimum = 6.8 – 2.9 = 3.9). This figure was used to determine the width of each group by taking the range (3.9) and dividing by the number of groups wanted. The width turned out to be .78 or .8 rounded (3.9/5 = .78). This means that each group will cover .8 such as the group 2.9 through 3.7. I determined the upper boundaries of my groups to be 3.6, 4.4, 5.2, 6, and 6.8. See below:
I then created a frequency chart and charted a histogram showing the results. See below:
The bin ranges were changed to include the beginning and ending number of each group.
Determining measures of central tendency gets a little more complicated depending on which method you use because you could come up with two possible answers. The mean is sum of all digits divided by the number of digits. In this case, the sum of all values is 123.4, and there are 25 total values. If you take 123.4 and divide it by 25, you will get 4.936. However, if you were to determine the measure of central tendency using the median method, you would get a different answer. The median of an odd set of numbers is the middle number in that group. This means that you need to group the numbers from least to greatest then take the thirteenth number in a set of 25 numbers as in this scenario. This answer will be 5. Remember from above that mode refers to value that occurs most often. In this case, it is 4.2 because it is the only numeric value that is repeated, therefore it appears most often.
This type of data can be analyzed further by using methods of variation. Sample variance is determined as such. We take the mean and subtract it from each of data values and square each result. Next, we take the sum of the squares and divide by the number of values. In this case, the sample variance ends up being 1.7. Now the standard deviation can be determined by taking the square root of the sample variance. This means the standard deviation for this scenario is 1.3 (√1.7 = 1.3). See below for Excel data analysis computations:
Conclusion
From the above information, I can conclude several things. First, there are more females than males, and the females seem generally more satisfied with their job than the males. Second, the average overall job satisfaction rating among all members is between 4.2 and 5. I can also tell that the overall job satisfaction rating spreads over a 3.9 scale.
References
Bluman, A.G. (2008). Elementary Statistics: A step by step approach. New York, NY: McGraw-Hill.