3.0 Test for stationarity
Our work is based on Time Series Econometrics and since empirical work based on time series data assumes that the underlying time series is stationary, we will first of all carry out tests to check whether the variables being used are stationary or not and whether they turn out to be stationary upon first differencing. Here, the Augmented Dickey Fuller Test (ADF) will be used.
The hypotheses are given as follows:
Ho: variable is not stationary.
H1 : variable is stationary.
The variable in its level form is tested. If test statistics is less than the critical values, then we should reject Ho, which means that the variable is stationary. we say it is integrated of order 0, I(0).
If Ho is not rejected, this means that the variable is not stationary. The ADF test is performed again on the first differenced form of the variables and checked for stationarity once more. If the test statistic is greater than the values of the critical levels, this confirms that the variables are integrated of order 1, I(1).
We continue this process until the variables become stationary. If the variable is differenced d times, we say that the variable is stationary of order d, I(d). If all variables are integrated of the same order, a VAR model can be used.
We will choose the lag length using the information criteria proposed by Akaike (1974). AIC will be taken due to its validity for both nested and non nested models and ability to Compare models with different error distribution terms by avoiding multiple testing issues. AIC = T ln (residual sum of squares) + 2n, Where n is the sample size, and T, the number of parameters included.
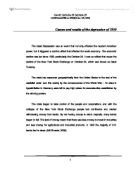
Results of ADF tests for unit roots of variables
Source: computed
Note:
1% critical value : -3.750
5% critical value: -3
10% critical value : -2.630
As can be seen, the table shows that in level form, all variables are non-stationary because the test statistics are greater than the critical values, i.e. the test statistics lie in the acceptance region, which means that the null hypothesis is not rejected.
However on the first difference we see that our computed values for all values exceed the critical values at different level of significance. We therefore reject Ho in favour of H1 and conclude that the variables are stationary on the first difference.
4.0 Regression results
Now that all the variables are stationary on the first difference, we should test the following equation:
∆INF = B0 + B1∆UNEMPLOY +B2 ∆MONEYSS + B3 ∆GOVEXPD + µt
Where:
∆ = The first difference operator
The regression results are shown in the table below:
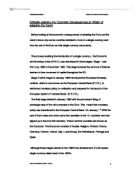
Regression results
R-squared = 0.3555
Adjusted R-squared= 0.2347
From the model we can see that all the independent variables are significant (p-value<0.05). Thus, we can say that the variable UNEMPLOY, MONEYSS and GOVTEXPD can be used to reliably predict INF (the dependent variable). The R-squared is 0.3555, when adjusted it becomes 0.2347. This means that about 23% of the dependent variable is explained by the explanatory variables.
From the regression, if we keep other explanatory variable constant, an increase in UNEMPLOY will have a significant positive impact on INF. For example, a 1% increase in unemployment is associated with a 0.92% increase in inflation. This is a robust evidence of a positive relationship between unemployment and inflation in Mauritius down the years. All other controlled variables have their expected signs and are significant. As per our regression results an increase in money supply will lead towards a decrease in inflation and an increase in government expenditure will increase inflation.
5.0 Testing for serial correlation
Durbin Watson (DW) statistic (original): 2.197475
Durbin Watson (DW) statistic (transformed): 2.026561
Serial correlation is tested using the Durbin Watson statistics. Serial correlation means that the error terms associated with observations of different periods are not related or are independent of each other. A value close to two shows that there is no correlation. A value close to zero shows that there is high positive serial correlation and a value close to 4 shows that there is high negative serial correlation. Durbin Watson is 2.197475, which is close to 2 and hence, we conclude that there is no autocorrelation.
Since the adjusted R2 < D.W statistic, the estimated regression does suffer from spurious regression. Granger and Newbold (1974) have suggested that an R2 > D.W statistic is a good rule of thumb to suspect that the estimated model suffers from spurious regression.
6.0 VIF (Variance-inflating factor)
Multicollinearity shows whether the dependent variables are correlated. The results from VIF (which are less than 10 for all variables) show that there is no multicollinearity present among the dependent variables.
7.0 OV test
Ho: model has no omitted variables
F(3, 13) = 8.97
Prob > F = 0.0018
We shall make use of the Ovtest to ensure there is no omitted variables in our model as specified above. Since the P-value is less than 0.05 we conclude that our model has omitted variables implying that our model specification is not good. In other words, our functional forms need to be adjusted. The Ovtest tends to show that our model is insignificant depending on the number of variable taken. Ho denotes that the model has omitted variables and with a P-value > 5% level, it is rejected. The omitted variables could be FDI, interest rate and imported inflation
8.0 Tests for Cointegration
Since it has been determined that the variables under examination are integrated of order 1, then the cointegration test is performed using the Johansen technique.
The Johansen technique has become a fast essential tool for applied economists wishing to estimate time series models. The implication that non-stationary variables can lead to spurious regression unless at least one cointegration vector is present means that some form of testing for cointegration is almost mandatory.
Using the Johansen technique, we will determine the number of ranks(R) with the help of trace statistic. The number of Cointegrating Relationship (N) is equal to the number of ranks.
The hypothesis testing is as follows:
H0: there is no cointegration.
H1: there is cointegration.
If N= 0, then H0 is not rejected which means that there is no cointegration.
Since there is no cointegration we will use a VAR model.
If N>0, then H0 is rejected in favour of H1. Then we will use a VAR Model with an Error Correction Mechanism (VECM).
8.1 Choice of lag length
Before carrying out the test, we should first choose the number of lags on which the model will be built. This is done by applying the function ‘varsoc’ to all first differenced form of the variables in the model. We shall use the AIC for the choice of lags.
The results for the optimum choice of lags are shown below:
The number of lags will be 4 where there is an * in the AIC column.
8.2 Johansen test
Considering the trace statistic column, it can be denoted that there is a rank of 3 which is indicated by the *. This means that there are three cointegrating relationships. Therefore, we shall use a VECM model rather than a VAR model.
9.0 Vector Error Correction Model (VECM)
A VECM can lead to a better understanding of the nature of the variables among the different component series and can also improve longer term forecasting over an unconstrained model. It specifically allows us to examine the long-term relationship between the time series and test for the existence and direction of causality.
Since the variables are supposed to be cointegrated, then in the short run, deviations from this long run equilibrium will feed back on the changes in the dependent variables in order to force their movements towards the long-run equilibrium state. Hence, cointegrated vectors from which the error correction terms are derived are each indicating an independent direction where a stable meaningful long run equilibrium state exists.
The VECM specification forces the long run behaviour of the endogenous variables to converge to their cointegrated relationships, while accommodates short run dynamics. The size of the ECM indicates the speed of adjustment of any disequilibrium towards a long run equilibrium state. (Engle and Granger (1987))
The general form of the VECM is the following one which is proposed by Hendry(1986):
∆INFt = B0 + B1INFt-1+B2 ∆UNEMPLOYt-1 +B3 ∆MONEYSSt-1 + B4 ∆GOVTEXPDt-1 + λ ECt-1+ µt
Where:
∆: First difference operator
ECt-1 : Error correction term lagged by one period
λ the short-run coefficient of the EC term ( -1 < λ < 0)
µt: error term
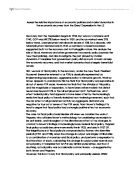
The error correction model with the computed p-values of the regression coefficients is reported in the table below:
R-squared: 0.5944
Adj. R-squared: 0.4100
Durbin-Watson statistic (original): 2.26
Durbin-Watson statistic (transformed): 2.22
The equation relates the change in inflation to the change in the dependent variables and to the error correction term in the previous period (EC t-1 ). the estimated coefficient of EC t-1 is statistically significant and is negative sign, which confirms that there is not any problem in the long-run equilibrium relation between the independent and dependent variables in 5% level of significance. This term indicates what proportion of the disequilibrium in INF in one period is corrected in the next period. As can be seen from the table, 1.57 of disequilibrium will be eliminated in one year.
The DW statistic is about 2.22 which is near to 2, meaning that there is no serial correlation present.
The VIF test shows that there is no multicollinearity, as all the values are below 10.
The percentage of the total variation of the dependent variable that is described in our model is not high enough (i.e. Adj R2 = 41%). We can infer that in the short run an increase of 1% on unemployment will lead to a decrease of 1.06% on inflation, while an increase of 1% on money supply will lead to a decrease of 0.82% and an increase in government expenditure by 1% will result in a 5% increase in inflation. The model confirms the existence of a negative relationship between inflation and unemployment.
10.0 Granger Causality test
Following Granger(1969), an econometric time series Yt is said to be “Granger-caused” by other series X1t, X2t or more if the information in the past and present values of X1t helps to improve the forecasts of the Yt variable. The procedure for testing Granger causality becomes more complex when the variables, be it the dependent or the explanatory ones have unit roots. Granger causality tests seek to answer questions such as:
- “Do changes in y cause changes in x?”
- If y causes x, lags of y should be significant in the equation for . if this is the case, we say that y “Granger-cause” x. there exists unidirectional causality from y to x.
- If x causes y, lags of x should be significant in the equation for y.
- If both sets of lags are significant, there is “bi-directional causality”.
- If y Granger cause x, but not vice versa, it would be said that y is strongly exogeneous.
- If neither set of lags are statistically significant in the equation for the other variable, then y and x are independent.
The model is further used to examine the Granger causal relationships between the variables under examination. As a testing criterion, the p-value (<0.05) is used. The results relating to the existence of short run Granger causal relationships between is shown below:
From the table above, the p-value in the first column shows whether INF cause UNEMP and the p-value in the second column shows the causality from UNEMP to INF. If the p-values are less than 0.05, this means that there is bidirectional causality (i.e. each variable causes each other) between the two variables.
It can be observed that there is no causality between INF and MONEYSS since the p-values are greater than 0.05. But there is unidirectional relationship between INF and GOVTEXP, i.e. GOVTEXP is causing INF which means that past values of GOVTEXP have an impact on current inflation rates. It can also be seen that UNEMP causes MONEYSS, GOVTEXP causes UNEMP and MONEYSS causes GOVTEXP.
10.1 Strong Granger Causality tests
The table above shows the strong causality among the variables. There is strong long run relationship between (1) inflation and unemployment, (2) inflation and money supply, (3) inflation and government expenditure. It can be seen that both money supply and government expenditure are causing unemployment. Moreover, money supply is causing government expenditure.
Considering the above findings, the causality between variables can greatly help policy making in Mauritius. Knowledge about the short run and long run relationships between variables enable good policy making e.g monetary policy and thus proper functioning of an economy. Since there is bidirectional long run causality between inflation and unemployment, the central bank should adopt monetary policy that will not increase unemployment in the long run.
11.0 Impulse Function
Tests for causality above only suggest which variables in the model have statistically significant impacts on the future values of other variables in the framework. Unfortunately, they are unable to explain the time frame of these effects or the sign of the relationship. Such information is given by the impulse response function which traces out the responsiveness of the dependent variables in a VAR/VECM to shocks to the error term. The impulse response functions are used to show the responsiveness of the dependent variable to a shock in the independent ones. These functions show the effects and sign of the relationship at different periods.
Thus, each variable is taken in a separate manner and a unit shock is applied to it with its effects noted. Thus if there are M variables in a system, a total of M2 impulse response can be generated.
We have 4 variables in the model, therefore 16 impulse response graphs can be formed but since we are interested with inflation as the response variable, only 3 graphs only will be interpreted.
11.1 Inflation and Unemployment
With a shock in unemployment rate at time t, share price responds negatively. It has a fluctuation effect on inflation for the first 15 steps, and stabilizes afterwards.
11.2 Money supply and inflation
It can be seen above that inflation rate will react negatively following a shock in money supply. There will be constant decrease in inflation rate after the fifth step.
11.3 Government expenditure and inflation
It can be noted from the graph that inflation fluctuates following a shock in government expenditure in the first 5 steps, and afterwards there has been a constant increase in inflation as government expenditure increases.
12.0 Variance Decomposition
Variance decomposition is an advanced form of impulse response function which enables the different analysis of the independent variables in their contribution in the change of inflation.
Variance decomposition is somewhere similar to impulse response but it additionally gives the proportion of the movements in the dependent variable that are due to their own shocks, versus shocks to the other variables. As a matter of fact, a shock to the ith variable will directly affect that variable, but its shock will also be transmitted to the other variables also through the dynamic structure of the VAR/VECM. The variance decomposition determine how much of the s-step ahead forecast error variance of a given variable is explained by innovations to each explanatory variables for s = 1,2, …, n.
Dependent variable: inflation
From the table above, following a shock in the independent variables, moneyss has the minimum impact on inflation with only about 0.007 to 0.09%. As concern to other variables, a shock in unemployment will result in a 0.2% response in inflation while a shock in government expenditure will result on average 0.9% change in share prices. The results obtained are quite similar to that obtained in the impulse response functions
13.0 CONCLUSION
This assignment elaborated on the analysis and findings of the relationship between inflation and Unemployment. The results obtained are in line with theory, which suggests that there is a negative relationship inflation and unemployment. Modern Economics accepts this assertion and has advocated that inflation using the Philips Curve Hypothesis shifts because of supply shocks and inflation is assumed to be built in the economy. Thus, the Central bank has to establish its credibility in fighting against inflation or have economic actors make bets that the economy will expand. It also focused on other analysis like granger causality, impulse response and variance decomposition.
14.0 APPENDIX
Data used for our analysis
- Test for stationarity
- Money supply as a percentage of GDP
14.2 Regression results
14.3 Serial correlation
14.4 Test for multicollinearity
14.5 OV test
14.5.1 Choice of optimal lag length
14.6 Test for cointegration– Johansen technique
14.7 VECM
14.8 test for granger causality
<0.05..means that u is causing inflation..
Past inflation is affecting current unemployment:
No causality:
No causality:
15.0 References
Textbook
Gujarati, Damodar N.: Basic Econometrics, 4th Edition, Mc Graw-Hill, New York, 2007
R. Carter Hill, William E. Griffiths and George G. Judge: Undergraduate Econometrics, 2nd Edition, University of New England, 2001
Christ, C.F Econometrics Models and Methods, John Wiley & Sons, New York, 1966
Mills T.C.: The Econometric Modelling of Financial Time Series, Cambridge University Press, 1993
Pindyck R. S and D.L Rubinfield: Economic Models and Econometric Forecasting, 4th Edition, Mc Gaw-Hill, New York, 1990
Harvey, A.C: The Econometric Analysis of Time Series, 2nd Edition, MIT Press, Cambridge, Mass, 1990
Websites
Central Statistics Office, Government of Mauritius [Online] Available at: http://www.gov.mu/portal/site/cso (Central Statistical Office, Mauritius)
Bank of Mauritius, Statistics and Reports [Online] Available at: www.bom.intnet.mu
International Monetary Fund, Mauritius Statistics [Online] Available at http://imf.org