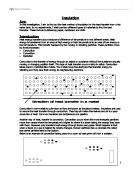
Convection current is set up which carries heat around the beaker.
Radiation Is the transfer of energy (heat) from one place to another by means of electromagnetic waves. Every object radiates infrared radiation; black matt surfaces are best at absorbing and emitting this. White, silvery, shiny surfaces are the worst absorbers and emitters Radiation travels through anything see-through including a vacuum. E.g. Tin foil would stop radiation.
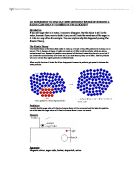
Evaporation
In a liquid the hottest particles are moving the
Fastest, fast moving particles near the liquid
Surface are likely to break free of the liquid and
Evaporate.
Only the fastest particles will achieve this, leaving the slower “cooler” particles behind. This lowers the average energy of the particles left in the liquid and so the liquid as a whole becomes cooler. It then takes in heat from its surroundings and thereby cools whatever its in contact with.
What am I trying to find out?
I am trying to find out what insulator is best at keeping the most heat in. I will try out lots of different insulators such as cloth, newspaper, a lid, none and bubble wrap to see what will happen. I am trying to find out if this makes a difference to how quickly it cools down if I was to use newspaper wrapped round it or a lid on top or if it doesn’t even matter.
Prediction
I think that the can that will keep the most heat in will be the can with newspaper round and I think the can without any insulation will loose the most heat due to radiation because this looses heat through the sides, I also think the can with the cardboard lid on top will keep quite a bit of heat in because there will be no convection. The can with bubble wrap around has air bubbles and air is a good insulator but I don’t think this will keep the most air in.
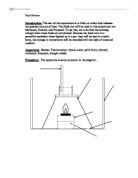
Method
I am going to use five copper cans of the same size and wrap one in newspaper, one with nothing, one with a cardboard lid on top one with bubble wrap and then one with cloth. I will then fill each can up with a 100ml of boiling water. We will then time each one using a stopwatch for fifteen minutes taking the temperature using a thermometer for every three minutes We will record the temperature in ºC. I will then record my results in a table and produce a graph.
I will need to make sure-
- The copper cans are the same size
- I use the same amount of water at the same temperature in each.
- I record my results the same time apart
- I use the same amount of newspaper and card etc each time if I redo any experiments.
- The same person records the data
- The thermometers are the same temperature to begin with
I will make sure I take accurate measurements of water (100ml) and I will also measure the amount of newspaper and card I use each time.
I will make sure this experiment is safe by not touching the copper cans once they have water in, and I will also make sure I have a clear area to work in before I start, so no accidents can happen like the experiment being knocked over as this is dangerous and will ruin our experiment.
Results
Experiment 1
None- 35.0ºC
Newspaper-32.0ºC
Cardboard Lid-38.0ºC
Bubble wrap-34.0ºC
Cloth-37.0ºC
Apparatus
Conclusion
In my results and on the graph I drew up it showed me that the can with the cardboard lid kept the most heat in, within fifteen minutes this only cooled down 28.0ºC the cardboard lid stopped the can from losing heat by convection. The second best insulator was the can with newspaper, then it was bubble wrap, the insulator, which lost the most heat, was cloth this decreased by 37.0ºC. The can without insulator started of quite well but then it ended up very close to cloth decreasing 35.0º C. This may have done well because metals are good conductors, but it could have been that we made a mistake. The graph showed that newspaper decreased by 32.0ºC, and the bubble wrap decreased by 34.0ºC.
We repeated the same experiment again to check for accuracy, and to correct the error, which occurred between the newspaper and non-insulator cans at about three minutes. We also did a second one to check the non-insulator can.
I predicted that the copper can with the newspaper around would keep in the most heat and then the copper can with a lid would be the next one to keep most heat in, I didn’t think the copper can with any insulation would keep most heat in because without any insulation it would loose heat through the sides due to radiation and through the top due to convection. I also said that the can with bubble wrap would do quite well because it has air bubbles and air is a good insulator.
My prediction was not right because the copper can with the lid on kept in the most heat, I think this was because the can doesn’t loose much heat through the sides just mainly through the top, so the can with the lid on kept in the most heat because there was no convection.
Error analysis / Evaluation
It was quite easy to get accurate results because there wasn’t much that could go wrong, as there were only a few things we needed to measure. Which were the 100ml of boiling water and the amount of newspaper and card etc we used.
I think that my results were reliable because when we done the same experiment for the second time they were very similar to the first one. And the temperatures for each one were quite evenly spaced. I think they were quite accurate because there were only a few anomalous results and these were not far of.
The sources of error were around three minutes on the first experiment for the newspaper and non-insulator cans also the non-insulator. But this was very similar on the second experiment.
If I have time I am going to do an experiment on the surface area of the copper cans, so we will use a small, medium, and large can and work out the surface area. We will not put any insulation around these because we are just experimenting the size, to see if this makes a difference to how long it takes to cool down. Also if we were to do it again we could use a data logger and heat probe, as this would be even more accurate. The results would be more reliable than using a thermometer. You can get the information straight away of the computer and it draws a graph for you.
Anomalous Results
I noticed that there were anomalous results on the graph. These did not affect the pattern. If I had more time I would have had done the experiment again. (Using a data logger and heat probe) as this would make it more accurate and reliable.
On the graph I drew a line of best fit for each experiment, the points that were not on this line, were the anomalous results. I ringed the anomalous results on my graph to show where the sources of error were. There were not to many so our experiment was quite successful.