==> INTRODUCTION
I have chosen to look at the connection between, height, weight, intelligence quotient (IQ), hours of TV watched per week, and Key Stage 3 Sats results. I am hoping for a strong connection between either height and weight and weight and IQ. I have chosen these because I think it will be interesting to see if the amount of TV watched does affect your weight because of being inactive for long periods of time. Also I would like to find out if people with higher IQ's don't watch as much TV as people with lower IQ's.
==> AIM
My aim will be to investigate the following statements:-
. Year 11 students are heavier and taller than Year 10 students
2. The higher the intelligence quotient (IQ) the higher the Key Stage 3 Sats Results.
3. The more hours of TV watched per week, the lower the intelligence quotient (IQ).
4. The more hours of TV watched per week, the more the student weights.
==> HYPOTHESIS
. I expect that the investigation of year 11 students being heavier and taller than year 10 students because as year 11 students are older meaning they would have started puberty before year 10 students making them taller and heavier.
2. I expect that the investigation of the higher the intelligence quotient (IQ) the higher the key stages 3 Sats results because I believe the more intelligent your are, the more chance you have of getting a higher score.
3. I expect that the investigation that the more hours of TV watched per week, the lower the intelligence quotient (IQ) because if you watch a lot of TV which could be soap, films, sports etc It isn't very educational, where as if you watched less and concentrated on your homework and revision your intelligence quotient (IQ) would increase.
4. I expect that the investigation that the more hours of TV watched per week, the more the student will weight, because if your watching more hours of TV per week it affects your weight as you are being inactive for long periods of time.
==> PLANNING
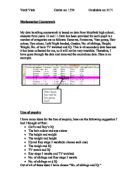
I will need to collect the following information:-
* Year Group:
* So I can make sure I collect a fair sample using Year 10 and Year 11.
* Surname:
* So it will make it easier for me to spot whether I have recorded the same piece of data more than once.
* Hour of TV Watch Per Week
* So I can investigate the statements that the more hours of TV watched per week, the lower the IQ and the more hours of TV watched per week the more the student weights.
* Intelligence Quotient (IQ):
* So I can investigate the statements that the higher the Sats results the higher the IQ, the more hours of TV watched per week the lower the IQ and heavier people have lower IQ's.
* Height:
* So I can investigate the statements that Year 11 students are taller than Year 10 students.
* Weight:
* So I can investigate the statements that Year 11 students are heavier than Year 10 students and heavier people have lower IQs.
* Key Stage 3 Sats Results
* So I can investigate the statement that the higher the Sats results the higher the IQ.
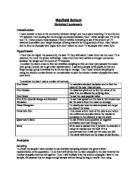
The information I have been given is in the form of a database sheet which is from a reliable and well known AQA exam board. However, there may still be some manual errors in the data from when it was being recorded and typed up. For example a student watched 190 hours of TV per week, but there is only 168 hours in a week. This is called a rogue error. Also, I will not be using all the information. For example, it tells me favourite colour, and number of brothers and sisters, which will be of no use to me in my investigation. Therefore, I will extract all the columns of useful data from the database sheet. These will be:-
I have chosen to look at the connection between, height, weight, intelligence quotient (IQ), hours of TV watched per week, and Key Stage 3 Sats results. I am hoping for a strong connection between either height and weight and weight and IQ. I have chosen these because I think it will be interesting to see if the amount of TV watched does affect your weight because of being inactive for long periods of time. Also I would like to find out if people with higher IQ's don't watch as much TV as people with lower IQ's.
==> AIM
My aim will be to investigate the following statements:-
. Year 11 students are heavier and taller than Year 10 students
2. The higher the intelligence quotient (IQ) the higher the Key Stage 3 Sats Results.
3. The more hours of TV watched per week, the lower the intelligence quotient (IQ).
4. The more hours of TV watched per week, the more the student weights.
==> HYPOTHESIS
. I expect that the investigation of year 11 students being heavier and taller than year 10 students because as year 11 students are older meaning they would have started puberty before year 10 students making them taller and heavier.
2. I expect that the investigation of the higher the intelligence quotient (IQ) the higher the key stages 3 Sats results because I believe the more intelligent your are, the more chance you have of getting a higher score.
3. I expect that the investigation that the more hours of TV watched per week, the lower the intelligence quotient (IQ) because if you watch a lot of TV which could be soap, films, sports etc It isn't very educational, where as if you watched less and concentrated on your homework and revision your intelligence quotient (IQ) would increase.
4. I expect that the investigation that the more hours of TV watched per week, the more the student will weight, because if your watching more hours of TV per week it affects your weight as you are being inactive for long periods of time.
==> PLANNING
I will need to collect the following information:-
* Year Group:
* So I can make sure I collect a fair sample using Year 10 and Year 11.
* Surname:
* So it will make it easier for me to spot whether I have recorded the same piece of data more than once.
* Hour of TV Watch Per Week
* So I can investigate the statements that the more hours of TV watched per week, the lower the IQ and the more hours of TV watched per week the more the student weights.
* Intelligence Quotient (IQ):
* So I can investigate the statements that the higher the Sats results the higher the IQ, the more hours of TV watched per week the lower the IQ and heavier people have lower IQ's.
* Height:
* So I can investigate the statements that Year 11 students are taller than Year 10 students.
* Weight:
* So I can investigate the statements that Year 11 students are heavier than Year 10 students and heavier people have lower IQs.
* Key Stage 3 Sats Results
* So I can investigate the statement that the higher the Sats results the higher the IQ.
The information I have been given is in the form of a database sheet which is from a reliable and well known AQA exam board. However, there may still be some manual errors in the data from when it was being recorded and typed up. For example a student watched 190 hours of TV per week, but there is only 168 hours in a week. This is called a rogue error. Also, I will not be using all the information. For example, it tells me favourite colour, and number of brothers and sisters, which will be of no use to me in my investigation. Therefore, I will extract all the columns of useful data from the database sheet. These will be:-