Both ways of lopping is not healthy for the trees, as now some trees that had been lopped are falling down.
POLLARDING COPPICING
Pollarding was usually used more as trees remained quite tall, which looked more attractive and the leaves were too high up for deer to eat.
ATTRACTIONS
People come to Epping Forest for a variety of activities, such as horse riding, hiking, cycling and for learning. Some people who live near by also come to the forest to walk their dogs.
Some groups come to the forest so often the staff at the field centre nickname them, for example the ‘view, brew n’ loo brigade’. This is a group of people who come to the forest simply to admire the view, to have tea at one of the many teahouses and to use the loo.
As Epping Forest is so big, it covers a range of different types of woodland. For us to see these different types of woodland we worked at two sites.
SITE 1
Our first site was the pillow mounds. It is called the pillow mounds because under the grass are mounds. It is said that these mounds have been there since 1066, when William of Normandy conquered England. It has been said that they have been there since that period, because that was when the first rabbits were introduced to England.
Erosion is such a problem in the pillow mounds because there is the king’s oak (a pub) is opposite and people often cut through the site to get to there.
On clear days there is a very good view of London, from the pillow mounds.
SITE 2
Our second site was Robin Hood green. It is called this because there is a pub near called the Robin Hood. Today the pub does not seem connected to the field, because a roundabout has been built between them. However until the early 1900’s the pub had been on the green and had used it for a cricket pitch. It was soon after the trees had been cut down to accommodate the pitch that people realised that rare plants were growing in the grass. When they realised this, the corporation of London, decided to stop the people from playing cricket on the green as they were trampling the plants. Ever since then the trees have been kept down to let the sun reach the plants.
The green is also home to many ants. All over the grass there are anthills.
From these maps you can see how the forest has been changed.
HYPOTHESIS
- Is car pollution more obvious in site 1, than in site 2?
We chose this to see which part of the forest is affected more by car pollution. From this pie chart we already know that over 75% of visitors travel to the forest by car.
- Is there more erosion in site 1, than in site 2?
We chose this to see if there was a link between the amount of erosion and the amount of attractions.
- Is difference in diversity of species is higher at site 2, than at site 1?
We chose this to see if there was any point to all the conservation precautions at site 2.
- Is site 2 noisier than site 1?
We chose this because we wanted to see if the amount of noise was due to the amount of attractions.
- Is there more litter at site 1, than in site 2?
We chose this to see if the amount of litter was connected to the amount of people, and to see where the corporation of London should put more dust bins.
- Is site 1 busier than site 2?
We chose this to see if there was any reason for the corporation of London to distance site 2 from the pub, the Robin Hood.
DATA COLLECTION
At each site we used quadrats and penetrometers to find out if the vegetation had been affected by trampling and to find out what the grass contained.
EQUIPMENT
To gather our data we used quadrats and penetrometers. Quadrats are metal tools that allow us to estimate a percentage of different things among the grass. Quadrats have a metal square frames and a hundred smaller squares inside.
Penetrometers are instruments for measuring the firmness of a solid material, by measuring the depth it may be pierced by a standard needle.
METHOD
- 20m x 20m plots were set. (as below)
- On these plots qudrats were used to see the ground covering.
- Then the amount of: Fine grass
Broad leaf grass
Bracken
Bramble
Moss
Leaf litter
Bare ground
Young tree
Sorrel - was noted
- Then a penetrometer reading was noted. (To use a penetrometer the marker has to be re set at 0. Then it has to be pushed slowly into the ground until the marker is at ground level. Then the reading has to be noted, 5-HARD / O-SOFT.)
- This was repeated at 10 random points on the plot. The same co-ordinates were kept at both sites.
As part of the group did this part of this, another part counted the number of people, cars and signs of management.
LIMITATIONS
In every experiment there are going to be limitations. In our experiment, for example we acknowledged the fact that we were there on an autumn weekday and that if we had gone to the same sites on a summer weekend we would have had different results. If we had more time we should have repeated the experiments to find an average, which would probably have been more accurate.
RESULTS
At site 1 we counted 10 people and 40 cars. At site 2 we counted 4 people and 96 cars.
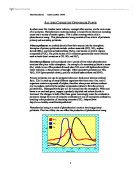
GRAPHS
SITE 1
SITE 2
ANALYSIS AND CONCLUSIONS
- Is car pollution more obvious in site 1, than in site 2?
Yes, car pollution is more obvious at site 1, as there is a car park right next to it.
- Is there more erosion in site 1, than in site 2?
Yes, there is more erosion at site 1, than in site 2, because many people cut through the pillow mounds to get to the ‘King’s Oak’.
- Is difference in diversity of species higher at site 2, than at site 1?
Yes, the difference in diversity of species is higher at site 2, as fewer people pass through and therefore there is less trampling.
- Is site 2 noisier than site 1?
Yes site 2 is noisier than site 1, because there is a main road quite close to the green.
- Is there more litter at site 1, than in site 2?
Yes there is more litter at site 1 than at site 2, because there are fewer people who pass through.
- Is site 1 busier than site 2?
Yes, site 1, is busier than site 2 because, it is closer to a pub, the car park and the information centre.
From this we conclude that site 1 is a honey pot site and site 2 is a conservation site.