My project also involves considering how glacial and fluvial deposits vary in:
- Sorting (division into coarse, medium and fine sizes).
- And the orientation of the B axis.
- And composition ( rock type )
The orientation is the alignment of the B axis.
River deposits are measured on a slip off slope and glacial deposits in a terminal moraine, with the following expectations:
- Water borne sediment will be sorted into size categories, the largest material being dumped upstream first, (upstream where the water flow is strongest) and the finest last (downstream where the flow is weakest). Glacial deposits however will be dumped irregularly because they ‘melt out’ of the ice.
- River sediment will have been rounded by river transport and attrition whereas glacial sediment, having only travelled a sort distance, will be angular.
And slip off slope deposits will lie with their B axis at right angles to the flow of the river whereas glacial deposits are thought to lie in the ice with their A axis parallel to the direction of flow.
Risk assessment.
The axis of a rock are as follows:
The A axis (Length of rock)
The B axis (Width of rock)
The C axis (Depth of the rock)
Apparatus needed for my investigation:
- Callipers
- Compass clinometer
- A water-proof notebook/pad
- A pencil
- Hand lens
- Sorting chart
- Powers Roundness index
- Measuring tape – 20m length
- Camera (to record locations and to provide secondary evidence)
- Map to find location and note grid references
Note
Because I was working in a group and am collecting data for the group it is imperative that each of us has their own role and each must keep to that role. This is because the sake of a fair test. For example,
If I read the callipers at the start I must read them throughout because the others eyesight and judgment may not be the same as mine, so if each person continues to do one job their judgment will not be too diverse.
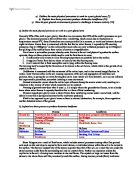
I am going to collect my evidence to prove my theory by doing thus:
-
Firstly I am going to assess the possible location of a moraine and a slip off slope.
- Secondly I am going to travel to the Glen Rosa valley area.
- Then I will proceed to go to the site and take photographs.
- I will measure the article in question by using a transect of the slip off slope/ terminal moraine.
- Then I will collect the evidence I need by accurately measuring and recording my results. I shall be looking at the ;
- Roundness
- Orientation
- Length of the B axis.
I will measure the transect by measuring a point across the hole moraine / slip off slope and divide it by 20.The results from that then apply to the collecting of the samples, at each interval one should proceed to measure the nearest sample.
I will measure Roundness by- comparing sediment sample to the guide shown below, this may be difficult to decide which category the rock goes into however for the sake of speed it was my primary choice.
I will measure orientation by – locating the b axis and using the compass clinometer I will measure the orientation.
I will measure the length of the B axis by – using callipers and reading off the rule.
I will collect 10 (20 if possible) readings from each site to give me a suitable range of results. The locations I have chosen are highlighted on the map and the grid references are below:
The terminal moraine - 987 382
The slip off slope - 987 383
I will record my results on the attached sheet. I will present my evidence as a range of graphs with attached section on collecting recording and presenting evidence.
Stage 2 collecting, recording and presenting evidence.
On the Day when we travelled to these two grid references the terminal moraine on 987 382 and the slip off slope on 987 383, I worked with 2 other people to obtain evidence/results for my investigation, they were Matthew Cruse and Lawrence Card. This was the original plan for the results table we were going to use.
However during collecting the evidence our group decided we could double the amount of our results in ample time. So this is the real results table we developed.
We were helped by 1 person in identifying some of the rocks, she was called Lucy and she was an instructor for this course. On the actual day we collected 20 samples from each site both the terminal moraine and the slip off slope.
Our results table is as below;
Graph sheet 1
Some graphs may help to show the evidence. Firstly the length of the b axis against the length of the slip off slope. (Sample every 1 meter).
Anomalous point
Graph sheet 2
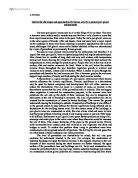
These are the results for the composition of both fluvial and glacial deposits.
Here O represents other specimen of rock
P is Phyllite and G is granite
Fluvial deposits
Glacial deposits
As it is clear here the fluvial deposits have more variation that that of the glacial deposits, the glacial deposits contain no other rock types.
Graph sheet 3
Charts to compare roundness of fluvial deposits against the roundness of glacial deposits.
It is clear here that glacial deposits are more randomised and do not follow any particular roundness, where as the fluvial deposits are mostly in-between the 2-3 category
Graph sheet 4.
Here are 2 charts to compare the orientation of the B
axis.
Fluvial orientation
Glacial orientation
Both graphs show completely opposite finding which was totally as I had expected, mainly the glacial deposits were all at right angles to the flow of direct which is what happens. The fluvial was parallel to the flow of water. The glacial sediments B axis was not parallel to the flow of the glacier because it travels on it’s A axis which is as I predicted.
Stage 3 description, analysis and interpretation of evidence.
All of my data I collected I believe I collected accurately. But unfortunately my results do not support my predictions very accurately which were;
- Fluvial sediment will be generally smaller than glacial sediment.
- Fluvial sediment will be more rounded than glacial sediment.
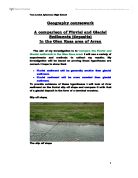
The graphs which show sorting on the B axis for the fluvial sediment are vast variations than those predicted although they do provide weak evidence (graph sheet 1). For example, on the photograph below it is clear that there is sorting on the slip off slope. This sorting is the absolute opposite to what I had expected in my prediction.
This variation may exist because it is a frequently visited spot and people very often pick up rocks to study them and cast them down in a different locations, this may have happened here. Or another reason could be my inaccurate measurements, or even the choice of my samples.
Section 4 drawing and justifying conclusion and evaluation.
Here were my main predictions
- Fluvial sediment will be generally smaller than glacial sediment.
- Fluvial sediment will be more rounded than glacial sediment.
Here are the sub predictions
- Sorting (division into coarse, medium and fine sizes).
- And the orientation of the B axis.
- And composition ( rock type )
As far as the sorting for the slip off slope is concerned, I found that my results are conclusive but very weakly so. The results did support my prediction roughly but not the extent I had hoped for. You can see evidence for this though section 3. Because I found that the slip off slope is not how I expected I have used additional secondary evidence to show what my results should have been like according to my prediction and the laws of fluvial deposition. There is only one reason I can see for my weak results for the slip off slope - human interference, it is easy to pick up something and place it down somewhere else, could that of happened here? Since it is a widely used site I believe this is the case. I believe that the evidence for the sorting I obtained from the fluvial sample appeared to be back to front the larger sediment should have been deposited at the front not the back.
The composition is definitely as I had expected. So as far as the composition is concerned I found a definite conclusion that my sub-predictions were true, the fluvial deposits covered a wider range of rock type because it could transport more diverse material than the glacier. Although there is little evidence to support this there is a definite link.
The orientation was not as I had of expected. I believed the glacier to be more randomised where as the fluvial to be more sorted.
Evaluation
We had a few problems during this investigation many of them minor, but a few were major.
For example, since we did not have any artificial light and light throughout the day was fading we may have made a few mistakes on measurements, this may be a reason for some if not all of the anomalous points.
One person in my group noted all of the data down on the day so we could have misjudged his handwriting and could have written variable data.
Below is a simple diagram of some of our problems:
The Main weaknesses and faults.
The main weaknesses during my investigation were the lack of conclusive results as shown in the graphs. However this could be rectified by using secondary data, such as maps, other people’s results as shown during my project shown after this page. As always any investigation can be improved by the quantity of evidence, and also the quantity. If I could obtain more evidence from different locations, i.e. not just from Glen Rosa it would provide a much better supporting structure for my predictions. Although this would involve thousands of pounds it would have a very accurate conclusion.