5). The gradient will decrease downstream.
There is a strong weak correlation between the gradient and the stream moving downstream. This proves my hypothesis.
6). The calibre of the load decreases downstream.
There is no correlation between the calibre of the load and the stream downstream but this may be because there we took random samples from the river and we only took six samples. There a slight decrease in the size of the bed load as the stream moves downstream.
Relationships
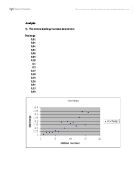
1). There is a negative relationship between the discharge and the gradient.
There is a strong negative pattern between the discharge and the gradient. The discharge increases downstream and the gradient decreases downstream. This proves my hypothesis. There is a strong pattern because on the upper course of the river there is a steep gradient, small number of volume and small amount of debris. As the stream moves towards the middle course there is plenty of debris for the work of erosion as the gradient becomes less steep and at the lower course there is a decreased gradient and an increased load and velocity is insufficient to move debris and so deposition becomes dominant.
Spearman's r test
R=1-6∑d2
N3 – N
R=1-6*908.5
4096-16
R=1-5451
4080
R=1-1.3360
R=-0.336
Our r-value of –0.336 suggests a weak negative correlation between the gradient and the discharge.
2). There is a positive relationship between the velocity and the gradient.
There is a negative relationship between the velocity and the gradient, which disagrees with my hypothesis. This is because at the upper course the gradient is steep but there is a small volume of water meaning that there is a low velocity but as the stream moves downstream there is a lower gradient and there is more erosion so the width increases making the velocity increase.
Spearman's r test
R=1-6∑d2
N3 – N
R=1-6*1080
4096-16
R=1-6480
4080
R=1-1.588
R=-0.588
Our r-value suggests a negative correlation between the velocity and the gradient.
3). There is a positive relationship between the velocity and the discharge.
There is a positive relationship between the discharge and the velocity. This proves my hypothesis. This is because as the stream moves downstream the width of the stream increases so the velocity increases which increases the load so there is not velocity to push the debris any further so it is deposited.
Spearman's r test
R=1-6∑d2
N3 – N
R=1-6*238.5
4096-16
R=1-1431
4080
R=1-0.351
R=0.649
Our spearman’s r test suggests a positive correlation between velocity and the discharge
4). There is a negative relationship between the hydraulic radius and the calibre of the load.
There is a positive correlation between the calibre of the load and the hydraulic radius. This disagrees with my hypothesis. This is because as the decrease in velocity causes the river to deposit its load further downstream than upstream. The hydraulic radius increases because there is a larger amount of water so the rivers width increases the hydraulic radius.
Spearman’s r test
R=1-6∑d2
N3 – N
R=1-6*712.5
4096-16
R=1-4725
4080
R=1-1.158
R=-0.158
There is a weak negative relationship between the hydraulic radius and the calibre of the load.