I did this by taking each sea defence one at a time and filled in the grid to whether the defence was:
Expensive or cheap
Ineffective or effective
Much visual impact or no visual impact
Manmade material or natural materials
Short life expectancy or long life expectancy
Much environmental impact or little environmental impact
As well as being any of the above I had to state how expensive or cheap the defence is, with a range from -2 to 2 (-2 being most expensive and ineffective etc and 2 being most cheapest and effective etc) . For example for groynes I ticked 2 for the ineffective or effective category, this mean that I think groynes are very effective.
By doing these bipolar analysis grids it will help me to answer key question number 3:
‘Why is the protected beach not retreating?’
The bipolar analysis tables help me to answer the key question above because you are seeing how effective each defence is for example, by saying the groynes are very effective it is a reason for the protected beach not retreating and it’s a certainty if the majority of the sea defences are effective.
The benefits of the bipolar analysis are that you get to study each defence and find out whether they are a success or not. If they are successful then it would answer part of the hypothesis as it would mean that the sea defences at Walton are a success.
The problems with the bipolar analysis are that it is only my opinion on how expensive or effective etc something is and it’s not evidence. Also it could be presented visually better to make the results easier to read.
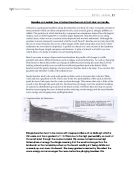
Sketches/Photographs
In my hypothesis booklet I drew sketches of examples of erosion and rotational slumping on the Walton coastline. We did this on the unprotected beaches.
I went to the unprotected beach at Walton and drew a sketch of the erosion. In the sketch it showed the overhang, the wave cut notch, the cracks, the collapsed cliff material and the high tide line. I also took some digital photographs of these features in the cliff. I then went to another part of the unprotected beach where there was an example of rotational slumping; again I drew a sketch of the slumping in the cliff showing the slumping material, thee red crag, the top of the cliff and the new edge of the cliff. Here I also took some digital photographs of the rotational slumping.
Doing these sketches and photographs will help me to answer key question two:
‘Why is the unprotected coastline at Walton retreating?’
It will help me because firstly I have detailed sketching showing the erosion occurring in the cliff, this would be a reason for the cliff to be retreating. I also have boxes next to my sketches in my hypothesis booklet explaining:
- Why the cliff retreats
- Why the wave cut notch forms
- What happens to collapsed beach material
The answers I have filled in will help me to answer the key question without having to remember as the information is written down. The photographs however are accurate evidence of the erosions occurring and therefore I can look back on them without having to remember what the cliffs look like and will help me to answer the key question.
The benefits of my sketches are that they are quite detailed and give me an idea of what the cliff was like and it was what I was actually looking at that day. The benefits of taking my digital photographs are that they are very accurate and may be a better choice if you aren’t the best artist.
The problems with the sketches are that you could have drawn what you like and so could affect they way you look at them later on. They are also not as accurate as the photographs. However the problem with photographs is that you could take them at any angle you like and therefore could change the way the photo looks and change the information the photo shows.
Traffic Count
In a group we took a traffic count in Walton, we did this activity on the cross roads of Kirby road, Church road and the High street. These roads are shown here:
At this location we recorded a traffic count of the vehicles going into and out of Walton town. This was carried out for fifteen minutes; my group did this activity at NEED TO ADD TIME HERE.
To record our results we used the table in our hypothesis booklets and used the tally system to note them down as the vehicles passed.
The vehicles we noted down were:
- Cars
- Vans/lorries
- Busses/coaches
- Bicycles
They were recorded in separate boxes to whether they were coming into Walton town or going out. At the end of this activity we also calculated the total amount of vehicles.
The tally chart I produced will help me answer key question four:
‘Is it necessary to protect the coastline at Walton?’
This activity helps me to answer the key question above because by recording these results I can compare the amount of traffic going in and out of Walton and if on category was more than the other it could change the way I look at the hypothesis for example if the traffic going into the town was more than the amount of traffic going out of town then the town would seem popular and maybe with the tourists therefore the sea defences would be necessary.
The benefits of doing this tally chart system are that it means you have reliable results that will later help me to answer the hypothesis. Also the tally system is a permanent record that you won’t forget, like you would if you calculated the amount of vehicles in your head. Finally it’s visually easier to read these results as they are clear.
The problems with the tally chart system are that you may record results twice or record them in the wrong category. Especially if the roads of Walton get really busy.
Questionnaire
The whole class completed a questionnaire on three different people in Walton; we did this in our groups.
We took this questionnaire in the town centre of Walton.
We did this by approaching three people, and explaining our situation. We then went forward and asked them four questions each, these questions were:
- How far have you travelled to get here today?
- How regularly do you visit Walton?
- Which features of Walton do you use?
- Do you think Tendering Council should continue to fund the maintenance and upkeep of the sea defences such as the sea wall?
These questions all had a multiple choice answer.
As we asked the people we marked the results down in the hypothesis booklet (page 14).
By doing this questionnaire it will help me to answer key question 4 which is:
‘Is it necessary to protect the coastline at Walton?’
The questionnaire will help me to answer the key question above as it will show the views of Walton’s public, this will also help me to answer the hypothesis as the best way to find out a key feature of a town is to ask the people of the town. It will also resolve whether the defence are necessary and how important Walton is to them.
The benefits of the questionnaire are that it helps to get a wider variety of opinions on the town and its defences. It also gets an important view as they are the people that use the town. The questionnaire is also good as they can all easily be put into a database and then we are able to see what the majority of opinions are.
The problems with questionnaire are that the answers could be bias. Also questions could be bias and there is a choice of what questions can be put in the questionnaire and what questions can be left out.
Land use survey
I did a land use survey which took place in Walton town; the survey is in my hypothesis booklet.
I did my land use survey by walking round Walton, in my group and exploring which roads were either:
- Residential
- Industrial
- Retail
- Business
- Recreational
There was a key at the top of our survey and for each of the categories above there was a colour code. I had to shade in the different streets according to the type of land use there, using different colours depending on the key. My group had a certain area of Walton to cover which is circled on the map in my hypothesis booklet.
By doing this it will help me to answer key questions four:
‘Is it necessary to protect the coastline at Walton?’
It will help me to answer this question as the land use survey would give me a detailed view on the town for example: It would show me if the town was
more residential or more recreational. This would make a difference to the answer of the key question above as it would show if there was a variety of uses in the town (residential areas, tourist areas, business areas etc.)
So this would also help to show the importance of protecting the coastline at Walton.
The benefits with a land use survey are that it give a very detailed over look on the town and it shows what parts of the town are used for different types of land use. It also shows the many different land uses used in Walton like the vast recreational areas and all the others listed above. Finally using the key and the different colours make this land use survey visually simple to read the information from.
The problems with the land use survey are that it may not be accurate and unless you did the survey in groups and split the town up for different groups to take on different areas then it could take a long while to fill the whole map in accurately.