The light bulb is submerged in 0.2kg water, and turned on for 900 seconds. The current and voltage of the electrical supply is noted and a table is made with initial findings.
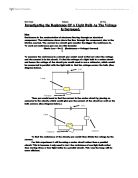
Circuit diagram of the experiment
The law of conservation of energy states that energy may neither be created nor destroyed. Therefore the sum of all the energies in the system is a constant. So the energy input is equal to the energy output.
I.e.
Electrical energy = Heat energy + Light energy
The results obtained are shown below
These results were collected, so that I can measure any quantities from this data to find my ultimate aim - efficiency. I can manipulate this result to produce desired set of results.
The first step is to manipulate the table of results that we have, so as to find other quantities which are useful to find efficiency.
The electrical energy is calculated first,
Electrical energy = Voltage x Current x Time
Temperature difference, ΔT = Final temperature – Initial temperature
Since the light energy is difficult to calculate, heat energy is calculated first and is deduced from the total energy in (electrical energy).
The heat energy = Mass (200g) X Specific heat capacity of water (4.18 J) X Temperature difference
E= mCΔT
Here mass and the specific heat capacity is constant the only variable is change in temperature.200 X 4.18 = 836. So this can be written as 836 x ΔT
Now we have the total energy in (electrical energy), and the heat energy. So we can find the light energy.
Light energy = Total energy in (Electrical energy) - Heat energy
The table of results showing the manipulated data;
These values are calculated using the program Microsoft excel.
Now efficiency of the light bulb at different voltages can be calculated by the formula,
Efficiency = Useful energy (Light energy) / Total energy in (Electrical energy)
Since efficiency is a ratio it does not have any unit. The percentage can be calculated by multiplying it by 100.
Efficiency % = Useful energy (Light energy) / Total energy in (Electrical energy) x 100
Graphs
This is my initial graph.
The graph showing Energy in (electrical energy) against useful energy
Above is my actual graph that I am taking results at.
Analysis of the graph
The graph clearly shows a trend that the higher the voltage the higher the Efficiency of the light bulb however as the line of best fit does not entirely cross all the points I believe that the readings are not exactly correct.
I theorize that for the majority of the readings the energy could also have heated the beaker and the table beneath losing part of the total energy, which was not measured therefore making all the readings incorrect (A systematic error).if the beaker was insulated ,we could have got more accurate results.
The experiment was not repeated, which makes it less reliable. Also no measurements were taken after 900 seconds.
For 6.0V the reading is far away from the line of best fit. This may be because of a number of reasons: The water may not have cooled completely between readings; there may have been a power spike during the reading meaning that the voltage was not actually 6.0V. The current could have been measured incorrectly influencing the initial equation for total electrical energy.
Conclusion
From my graph I can conclude that for these values the higher the voltage, the higher the efficiency of the light bulb, however this does not necessarily mean it will be true for all voltages. There has to reach a point when increasing the voltage will no longer increase the efficiency as the highest efficiency the bulb could theoretically attain is 100% efficiency and it is unlikely that it would even reach 100% efficiency. Also the bulb has a maximum voltage which once crossed will burn the bulb by burning out the filament, meaning the efficiency will be effectively 0%.
The average efficiency of the light bulb is 35.54