-
The temperature of the experiment will be kept at a constant rate. This will be done using a water bath kept at 38.5oC, as this is as near to a calf/ox body temperature as possible, therefore replicating as closely as possible the conditions inside the animal, giving the substrate particles and enzyme, a temperature where they can work at a comfortable rate. The rate will be constantly checked using a thermometer. As the breakdown of hydrogen peroxide is exothermic (gives out heat) means having water around the tube will help disperse any extra heat.
- By using a buffer, the pH level can be kept at a constant rate. I will need a buffer which keeps the pH at pH 7.4, as this is the pH of animal blood. This means that the enzyme will not be at risk of denaturing; therefore accurate results have the chance of being obtained. If the pH is altered, some of the internal bonds might change because of changes in the ionisation of amino acids.
- Controlling the concentration of the catalase by weighing at the same mass of tissue for calf and ox liver. This will be done using an electronic balance, which will weigh out 5g of each type of liver. I will also control the blending, by cleaning the blender very well before and after each use, for both types of liver. The use of a muslin cloth, will act as a filter so that only the liquidised liver is used, leaving any solid particles out the experiment, which may change the results.
-
Washing off the immobilised catalase beads with de-ionised water, as they may still have calcium carbonate on them, when they were going through the process of hardening. The calcium chloride (CaCl2) may act as an inhibitor during the reaction with the H2O2, which could lead to results, which may be inaccurate.
Apparatus
To successfully complete my experiment as accurately as possible I will need:
- Stop clock – measure time taken for beads to rise
- De-ionised water – to wash off any calcium chloride on the beads
-
250cm3 of 0.4 mol dm-3 Hydrogen peroxide – subject to change after pilot test, 250 cm3 needed for 10 repeats of each tissue, and any spare for spillages
- Sodium Alginate – to aid in manufacturing the beads
-
Calcium Chloride solution – to harden the bead mixture - 0.1 mol dm-3
-
Water bath – to keep temperature constant set at 38.5oC
-
Thermometer – to measure temperature of H2O2 in water bath
- 0.9% saline solution – to keep the mixture ‘isotonic’ with the blood
- pH 7.4 buffer – to keep pH level constant, at that of blood
-
5cm3 syringe - for the bead mixture to help mix, and get the correct amount
- 2 beakers – to help mix the alginate jelly with the liver solution
- 10 test tubes – for repeats
-
Test tube rack – to hold test tubes with the H2O2 in.
- Blender – to liquidise the liver and mix it with the saline solution
- Funnel – to help with the cleaning process of the beads
- Muslin cloth – to filter out solid parts not blended
- Vernier callipers – measuring alginate beads
- Graph paper and ruler – secondary way of measuring alginate beads
-
10cm3 pipette with pipette filter – measure accurately, any volumes needed
- 5g of Calf liver – to extract the calf liver catalase
- 5g of Ox liver – to extract the ox liver catalase
- Tweezers – collecting the beads
Risk Assessment
To complete my experiment as accurately as possible I need to work in a risk free environment, so not to damage my results, other students in the class and myself.
Hydrogen peroxide is one of the bigger risks in my experiment. This is because it is a corrosive substance. The correct definition for a corrosive substance is:
Causing or tending to cause the gradual destruction of a substance by chemical action.
It is combustible with flammable material, and therefore is a fire risk. This means, that fire blankets and fire extinguishers will be present in the room, in case of fire.
If the H2O2 that I am using has a high concentration, then it is a potential toxin, as it can be an irritant, to skin (including the eyes) and mucous membranes, where it can be caustic.
As the reaction between catalase and H2O2 produces lots of oxygen, then if a student manages to swallow some of the solution, then the reaction would produce a sudden expulsion of oxygen, which in turn would bloat the oesophagus and the stomach, acute distension of the stomach, is a strong possibility.
If this does happen, internal bleeding, nausea and vomiting may result. In this case, medical advice should be sought, and if the student needs a hospital, information about the chemicals, they were using, and medical treatment already given will be sent with them.
H2O2 is also very corrosive with organic compounds like ethanol, and metals/metal oxides like Tin (II) Chloride.
In my opinion the most likely occurrence of a problem, is accidental spillage or splashing of dangerous chemicals. Therefore, goggles must be worn to protect the eyes, and lab coats should be worn to protect any bare skin.
The liver is a potential source of pathogens, which can lead to disruption of the respiratory system, and could lead to cancerous cells being produced. This means that the liver needs to be kept in the refrigerator, to keep it fresh, and wearing gloves when handling it also. After the liver has been used, it needs to re-wrapped, when it is finished, dispose of in a bin, to protect others e.g. lab technician.
Calcium Chloride is an irritant, and will be irritating to eyes/skin/respiratory system if it comes into contact with it. If it comes into contact with anhydrous salts, this will cause water to be boiled.
Enzymes are potential irritating allergens, they can irritate membranes of eyes, and skin is sensitive to them. If part of an enzyme does come into contact with the eye, it should be flooded with water for 10 minutes, to get rid of the enzyme particles.
Pilot Test
The first test I need to do is to find out what concentration of H2O2 should be used in the experiment, as to strong a concentration, would bring the beads to the surface to quickly, and to weak a concentration, would keep the beads on the bottom for too long before rising. As a guide, if the bead doesn’t hit the bottom before rising, then the concentration is to strong. A concentration that keeps the beads on the bottom of the test tube for approximately 10 seconds before rising will be about the right concentration. I will use a range of concentrations to start with; the dilutions will be made with de-ionised water.
Table 1 - A table to show how dilutions of H2O2 will be made -
Table 2 - A Table to show how varying the substrate concentration affects the rate of catalase activity
Outline Plan
The first part of the experiment is to make the catalase enzyme, into immobilised solid sodium alginate beads. This will be done by mixing 95 cm3 of 0.9% saline solution with 5g of which ever type of liver. These will be mixed for 3 minutes, to make sure they have mixed together properly. The saline solution makes the solution isotonic with blood, ‘having the same salinity as body fluids.’ This will give the liver the same conditions found in a living animal.
When the blending is done, using the muslin cloth as a filter, I will pour the solution into a beaker with sodium alginate in it, then using a stirring rod; stir the two solutions vigorously for 1 minute. Then, I will suck up some of the solution into a 5 cm3 syringe, making sure I pump the contents in and out a couple of times to make sure the two solutions are well and truly mixed.
The next stage, of making the sodium alginate beads is slowly, adding droplets of the solution in the syringe into another beaker containing 0.1 mol dm-3 of calcium chloride solution to harden the beads. The beads then will be washed, to make sure the calcium carbonate is rinsed off, so it doesn’t inhibit the reaction in anyway. Once this is done, they are ready for use.
Using Vernier callipers, at a set distance – 3mm, I will pass through the beads, leaving ones, which fit snugly into them aside. Around 10 beads will do, 8 for the experiment, and 2 spare in case of breakages.
The next stage is putting the H2O2 and the buffer into test tubes, by measuring out 5cm3 of pH 7.4 buffer and 5cm3 of H2O2. This will be done with the use of syringes.
It is very important that the two parts are as close to equilibrium as possible, to get them as close to conditions found inside the animal. I will heat both the H2O2 solution and the beads, in a heat block; set at 38.5oC, using a thermometer to measure the rise in temperature.
Repeats are extremely important in this experiment, as so much is being controlled. Therefore, quite a few factors could affect the experiment. Repeats act as a marker for the reliability of the results. Repeats show me how reliable the overall results are in the experiment, by working out percentage errors, and error bars on graphs etc. If several repeats produce similar results, this will tell me that I have controlled the variables well and that my results are reliable. Conversely if my repeats produce variable results this will tell me that one or more of the variables have not been well controlled and so the results are not reliable. My aim in this experiment is to control all of the variables as best as I can. This will bring reliable results, and allow me to test the hypothesis.
Analysis
Below are the raw results, summary table, and a processed data table, from the results gathered in my experiment.
Results
Table 3 – A table to show raw data of the 8 repeats of each type of liver catalase, showing how long each bead takes to rise to the surface
Table 4 – A table to show the rate of catalase activity two types of liver catalase, in arbitrary units
The results in table 4 were calculated by dividing the raw amount e.g. 6 seconds by 1. E.g. 1/6 to give the result in arbitrary unit’s 1/T.
Table 5 – Table to show the Mean, Minimum and Maximum rates of catalase activity
Using the data that I have calculated in the above table, I will make a bar chart showing these values.
Table 4 and 5 - All figures are to two decimal places.
With the processed data I have produced (table 5) I have made a bar graph to show the mean rate of catalase activity of both types of liver catalase. The error bars shows the difference between the maximum rate and lowest rate.
From looking at the data on table 5 and from the graph, I can clearly see that the mean rate at which the calf liver catalase beads reacted with the H2O2 is faster than the mean rate of the Ox liver catalase beads by 0.20 arbitrary units. The calf liver catalase is more than twice as fast in reacting compared to the ox catalase beads.
Catalase is an enzyme that breaks down hydrogen peroxide – a waste material of chemical respiration, produced from any aerobically respiring cells. Respiration is the chemical process used to produce ATP for cells. ATP is the cell’s direct source of energy. The greater catalase activity in calf liver suggests that there may be a faster rate of hydrogen peroxide production in calf liver than in ox liver because the rate of cellular aerobic respiration is faster.
This is because the calf, is more metabolically active than the ox overall. As it is younger, it naturally moves around more than the ox, and therefore, more ATP (Adenosine Tri Phosphate) is needed. This means in calf tissue like a liver, the rate of respiration is faster, to keep up the demand of ATP production of the calf cells. There is more catalase in the cells, to help remove the excess hydrogen peroxide. ATP could be used in the liver for processes such as active transport and protein synthesis.
Whereas with the Ox, an older and mature animal, the liver tissue may not be working at the same capacity as the calf liver, due to possible infections, and a lesser need for ATP production, due to the Ox not needing to be as active as a calf. A fully grown ox would only be synthesising new compounds for replacement, not for the production of extra cells for growth.
Aerobic respiration takes place in the mitochondria of cells. There are 3 stages of aerobic respiration:
Stage 1
The first stage takes place in the cytoplasm of the cells. Glucose is converted into a 3-carbon compound called pyruvate.
Stage 2
The next stage, involves the mitochondria breaking down the pyruvate, the following equation shows this conversion:
Pyruvate CO2 + hydrogen
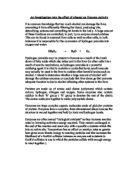
A diagram to show the Mitochondrion organelle
Cristae
Pyruvate
The pyruvate enters the mitochondria through the outer membrane, then into the inner (folded) membrane, into an area called the matrix by facilitated diffusion. The matrix contains cristae (represented by the black circles). These are very important in the next stage of the process.
Stage 3
At the cristae: Hydrogen is then used to activate the ATPase. This is an enzyme, which makes ATP.
ADP + Pi ATP
The hydrogen then reacts with the oxygen:
2H + O2 H2O2 (toxic)
The final stage is for the H2O2 produced, to be broken down. This is done by the enzyme catalase, in the following reaction.
catalase
2H2O2 (aq) 2H2O (l) + O2 (g)
Evaluation
Looking at the error bars of both types of liver catalase, I can see that the range of results is approximately the same between the maximum and minimum results for calf – (0.13 arbitrary units between minimum and mean and 0.12 arbitrary units between maximum and mean).
For Ox, the range is much smaller – a 0.02 arbitrary units range between maximum and mean, and minimum and mean. This shows that the results for the ox liver catalase are less variable that for the calf liver catalase.
After looking at the raw results, I can say that there are no anomalous results. This is because there are no significantly different repeat results in the raw data. The results show low variability. This means that all the variables that I stated were controlled successfully. Overall with the controlled variables I have got reliable results.
Looking at the graph I have produced, I can clearly see that there is no overlap between the two error bars of the calf and ox liver catalase. This means that the results are significantly different, showing me that overall, my hypothesis of the calf liver catalase reacting quicker than the ox liver catalase has been proved correct. Although I realise that I have only tested this hypothesis using one calf liver extract and one ox liver extract. To make sure that this hypothesis is correct I would need to test the livers from several different calves of the same age and species and compare the results with data from several different ox livers of the same age and species.
Overall, in my opinion my hypothesis has been proved correct. I am able to say this because my results were reliable, as none of the raw data had any anomalies. This means that the variables were controlled to an extent that, very similar results were given off for each repeat.
But, one of my variables wasn’t as controlled as it should have been. In my plan, I wanted to have exactly 5 grams of each type of liver weighed out. This wasn’t quite the case, as not exactly 5 grams were weighed out:
Calf liver – Ox liver
4.98g – 4.86g = 0.12 g
Ox liver Calf liver
0.12 x 100 = 2.46 % 0.12 x 100 = 2.40%
4.86 4.98
This means that 4.98g of calf tissue were used compared to 4.86g of ox tissue. This means that there was more calf tissue and a greater source of enzyme but only a small percentage, not enough to account for the differences in the results. Although this variable wasn’t as controlled as it should have been, the overall effect in percentage error is very small, so wouldn’t affect the overall results very much.
Another variable, which is very difficult to control, was the size of the beads. The size is important, as with a bigger bead, there is more surface area, meaning more of the H2O2 could be hydrolysed by the catalase in the bead. I managed to control this though, with the use of Vernier callipers, which were a great asset, as they are so accurate. I set it at 3.0mm, and put different beads through the arms until I found 10, which just fitted into the arms. I had 10; as 2 beads were spare in case of accidents.
Although I carried out the procedure in a water bath I did not allow the beads time to equilibrate (reach the right temperature) before testing them. The method could be improved by allowing the beads to equilibrate first for 10 minutes. To get to the correct temperature found in the animal’s body (38.5), This would mean that the catalase in the beads would be working at near-maximal rate.
Time is also another limitation that may have affected my results slightly. This is because; I only had time to complete one type of liver per lesson. This meant, that as the second liver to be made into beads, the calf liver had to be put into a fridge for a couple of nights, to stop it going off. This may have made the enzymes in the liver to work at a lower rate, as they were not at the optimum temperature of 38.5oC; they were only a few degrees above freezing. The enzymes may have become less active.