My thermocouple was made from two pieces of cooper and a piece of constantian. I fixed the three wires together by bounding the two wires together tightly. I had to make sure the connections were tight as explained above the junctions are the parts of the senor, which actually take the measurements. Here is a diagram of my sensor.
The first thing, which I needed to do, was to calibrate my thermocouple. I calibrated it against a mercury thermometer. To do this I needed to put the connections of my thermocouple into differing temperatures. I started of with some water and ice at 0oC and some at room temperature. During the experiment I found it hard to keep my water at 0oC so I decided to keep the water at 5oC instead. I did this I because I expected the lowest window temperature to be over 5oC. This would not cause any problems as you measure the temperature difference between the two beakers of water and not the temperature from 0oC. For the calibration I put one end of the thermocouple in the beaker of water at 5oC and put the other in a beaker of water that was 15oC. I then set up a circuit and around the wires I placed a digital voltmeter, which could read the EMF given off by the thermocouple. The precision of the digital voltmeter was 0.1mV. Below is a diagram of how I set up my calibration.
I started the calibration by taking the readings from the Digital Voltmeter when the temperature was at a 10oC difference. I then heated up the beaker at 15 oC with the Bunsen burner then at every 10oC interval I took a measurement of the Digital Voltmeter. When using the Bunsen burner I had to make sure that I had clear desk space and when I was not using it I had it on an orange flame. I repeated this three times and took an average in order to make the results credible. This was done until I got to a temperature of 95oC, a difference of 90oC. I could not go over 100 oC, as this is the boiling point of water. From previous experiments with a thermocouple I knew that the calibration would give a linear response. Below are my results from the calibration.
Also attached is the graph of the calibration on which is the best-fit line which I used for all my readings. This can be found at the end of the project. I know from previous work with a thermocouple is that if you double the temperature you double the voltage. From my graph at 40 oC, the voltage given is 1.75 x10⁻³ V. Then form the graph at 80 oC, the voltage given is 3.5 x10⁻³ V. This proves my calibration was successful.
As you can see from my results the voltage given off by the thermocouple is very small. To improve this I could next time amplify the readings. This would be better as I would have large readings with more of a spread. Instead of 0.4mV between 10oC I could have 4V. This way I could tell whether the temperature change just is not from the uncertainty of the digital Voltmeter. During the calibration I also found the response time of my thermocouple. For a temperature-controlled system, the response time is the time taken for the system to respond after its temperature changes. For example, a home heating system with a response time that is too long would not start to warm the building as soon as its temperature fell below the desired level. For this I took five averages, I inserted the thermocouple into the non-controlled beaker of water and waited for the reading on the Digital Voltmeter to be constant. For the response time you have to take in consideration that you are measuring the response time of the wires and the Digital Voltmeter as well as the response time of the thermocouple. Here are the results:
From my tests on response time I decided to make sure I waited for at least four and a half seconds, when taking the temperatures, before I took the reading.
Also from the calibration I could work out the sensitivity of the thermocouple. Sensitivity is concerned with the size of the output of an instrument, compared to its input. The sensitivity of a measuring instrument is the change of its output divided by the change in input. A temperature sensor whose output changes by 100 mV for a change of 2 K in its input has a sensitivity of 50 mV per Kelvin The more sensitive an instrument is, the greater the change of its reading for a given change of the variable causing the change.
In an instrument in which the change of the reading is directly proportional to the change of the variable would, on a graph, cause a straight line through the origin. The gradient of the line is equal to the sensitivity, which is the same across the full range of the instrument because the line is straight.
So the sensitivity of my thermocouple would be:
EMF/temperature change
For the thermocouple 4.2mV/100 oc = 0.042 mV/ oc
As you can see this value is very small, it shows that the Thermocouple only gives off very small amounts of EMF.
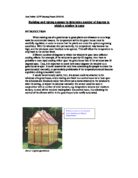
Once I had calibrated my thermocouple I was ready to begin my experiment. For my experiment I chose a window in my physics laboratory. In order to show the points on the window where I will be measuring I will draw the window and label it with a key.
I measured the window and found it to be 95cm tall and 60cm wide. From this I could work out where on the window I would be taking my measurements. Once I had found all my points I stuck bits of sellotape to the window so I could clearly see where I had to take the measurements.
When taking the measurements of the window it was very similar to the calibration. I had to put on of the junctions into a beaker of water with temperature of 5 oC, but the other junction went directly onto the window. Around the junctions I had a Digital Voltmeter attached with wires and crocodile clips taking the readings. Due to the height of the window in order to reach it with all my equipment I had to stack chairs and rest my equipment on them. The chair tower got higher as I had to measure higher points on the window. Here is a picture of how my actual experiment looked.
I also had to make sure that I was using the same ends for each job, one end for the beaker of water and one end for the window. For this I sellotaped on a label nearest to one end with my initials on. The end nearest the label was used for the window. I also each time had to dry the end, which went into the water with a towel to make sure the test was fair and to make sure the Digital Voltmeter read zero before taking another temperature. I took a reading of each point three times and found an average. I did not take the readings in consecutive goes.
I started with the inside of the part of the window. I took a reading of the room temperature with a mercury thermometer and found it to be 21 oC. I then carried on with my experiment, but I did have a problem where the temperature of the beaker of water. On a few occasions the beaker rose above 5 oC, so I had to add ice to the beaker and redo my set of results for the part of the window, where the beaker was above the required temperature. For the window position column please look at the diagram on the previous page in order to find the positions. Here are the results.
I worked out the actual temperature by reading it of my calibration graph. I went up my vertical axes and found my voltage, then went across to the line of best fit and followed down from that to the horizontal axes where I read off the temperature then added five to that total because during calibration the cold beaker was at 5oC not 0 oC. The calibration graph as stated before is at the back of my project.
As you can see from my results there was a correlation between the further you go up the window the higher the temperature is. I was surprised though about the range of temperatures. I feel that 4 oC temperature changes from top to bottom is very big with a window so small. This could be due to the level of accuracy. When I worked out the averages I had to round my results up to two decimal places. If you look at my graph 0.1 millivolts covers about 3 oC. This could be why the difference is so big. Also the uncertainty of the digital Voltmeter was 0.1mV. This could also prove to be why there is such a big range of temperatures.
Unfortunately I had to do the outside experiment on a different day to that of the inside. This obviously makes the experiment not as fair as it should have been. But both days were of similar weather, quite cloudy with a few breaks of sunshine. When I started the outside phase of my experiment I took the air temperature and found it to be 15 oc. I then carried out the experiment in exactly the same way as I have previously explained. Though this time it was easier as being outside where it is colder the temperature of the beaker of water stayed at a constant 5 oC. Once again please could you refer to my previous picture with the key for positions. Here are my results for the outside part of my experiment.
Please remember the top left of the outside part of the window is not the top left part on the inside. The corresponding part to the top left of the outside part to the inside part would be top right. This is the same for all the results.
Once again you can see that there was a correlation about the higher up the window you go the higher the temperature. Once again I feel the range of the temperatures are quite big. I feel the explanation given earlier would explain the same thing here. Also with the outside part of the window you have the weather to think about. The wind could have an effect the temperature of the window.
The sun could also be a reason for why the window gets hotter as you get further up it. The position of the window is that it is not directly in the sun. It is North West facing. This means that different parts of the window may get different amount of sunshine through out the day.
Also you have to think about Convection. Due to convection the higher parts of the window would be hotter than the lower. When the bottom of the window is heated up by the sun, the heated air expands and becomes less dense therefore it rises. As this happens cool air rushes into replace the warm rising air. Then is the risen air cools it contracts becomes dense and falls again to the bottom of the window. Here is a diagram.
If I were to do this experiment again there would be a few things I would change. The first thing would be to do the whole experiment on the same day. I feel this is the biggest reason why the results for the top of the outside window were so. I would also choose a taller window. This would be better for trying to prove the relationship of as you get higher up the window the temperature would be higher. I would also try and use more accurate equipment, especially the digital voltmeter. This is due to the difference of temperature between 0.1mV. This would make the experiment more accurate. Also to make my results more accurate I could try to amplify my results this way you would be able to see a clear difference in voltages, not use 0.1mV. From this you could tell whether the changes are significant or just uncertainties. I could also try windows, which were situated in different places relevant to the sun, this would prove whether the sun’s rays affect the temperature of the window.
Unfortunately as I did not know the thickness of the window I could not find the thermal conductivity of the glass, but the temperatures from the inside to the outside was a difference of about 5 oC. I feel that this is a sensible figure considering the window was just a single panel and not double-glazed.
I do feel that my experiment went quite well. The calibration proved successful as I got a straight line for my line of best fit. Also I feel that I got sensible results for the temperatures apart from I felt that the range was quite big. You can see that there is a trend of, the higher up the window the higher the temperature is, but as the potential difference measured were so small I could not be sure that this was not down to some uncertainties.