- Width should increase as it approaches River Calder
- Velocity should also increase approaching River Calder
Theory:
Width –
As Hyndburn Brook approaches River Calder from the source, it should increase in width. This is because, as the river moves further from the upper-stream source, lateral erosion happens. This contributes to a greater velocity as there are not many rocks present which act as obstacles to the river’s flow – this will result in a greater erosive force, widening the channel further by Hydraulic Action.
Therefore I expect to see a channel that is wider in Location 3, next to Mill Hill, than in Location 1, near Dunkenhalgh Park Hotel.
Velocity –
I expect the velocity of Hyndburn Brook to increase as I move away from its source.
This is because there are many boulders which form ridged wetted perimeters. These, despite the river’s steep gradient, significantly decrease water speed as water will have to travel through these. As the river moves away from its source, and the rocks are more readily eroded, the channel bed will become smoother (therefore there is much lesser friction), increasing the velocity.
I will only expect to see contrary results if there were heavy rains/storms recently prior to my arrival at the river. This is because water will be able to surpass these obstacles with the forward force provided by the sheer amount of water falling, combined with the steep gradient at the upper-course.
Methodology:
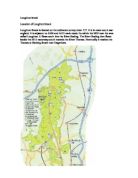
On Saturday 21 March 2009, I have travelled with a friend from Blackburn Bus Station to Hyndburn Bus Station, walking to near Dunkenhalgh Park Hotel, where my first location was.
Width –
We stood at opposite sides of the river, holding out a tape-measure. We held the tape-measure 20 cm above the water to make sure that the reading would not be disturbed by the river’s current. We swapped sides and repeated the method to ensure that readings were similar; if this is agreed on, the result was noted. We found that, as we moved to site 3, the river was much wider. Therefore, to ensure accuracy, we repeated the method four times, swapping sides two times and then taking a final average.
Velocity –
To measure the velocity we used two large branches (from the ground). These were mantled opposite to each other in a ‘straight’ line, 5cm in the first three sites and 10 cm in the third site. 5cm was a good distance apart because the channel width is narrow and the amount of water was sparse between the first two sites, only showing a noticeable increase on the third site.
We used an empty folder as an object to travel between the two branches. This was done because a folder would not get wet, would travel at a good speed (not too quick that the time cannot be noted, neither too slow that it will penalise the final result) and has a distinctive shape/colour to avoid confusion (its weight is also insignificant enough to take account of). A (wrist-watch) timer was used to time the process as I placed the folder in line with the first branch; as this was done I shouted ‘start’ to prompt my friend to start the timer. The time it took for the folder to travel between the two branches was thence used to calculate the velocity using V (ms-1) = D (m)/t(s)
I repeated this method three times for each site, from which a mean (for each site) was obtained to compare the average change in velocity between the three sites.
Results and Interpretation:
Channel Width –
There is a greater increase in width between sites 2 to 1 (1.16m) than 3 to 2 (0.92m), this could be because there is greater lateral erosion (as the source is upstream) at sites 1 to 2. This decreases between sites 2 to 3 because the river approaches a wider course however with greater velocity than in sites 1 to 2 (as seen in the next section), influencing lateral erosion further. This shows that Hyndburn Brook fits the Bradshaw Model.
Velocity –
There is an overall increase of 0.8m/s in the velocity with most being gained between sites 2 and 3. This is could be because I have visited Hyndburn Brook on a sunny day (therefore no rain to bring storms), so the river in the upper-course was slowed down by the boulders (which acted as obstacles), this could account to why the river had only gained 0.2m/s in the first two sites. The river was also twisty (meandering) throughout the first two sites.
At site 3 the velocity increases by 0.6m/s, 3* that between 1 and 2. This could be because the channel is now much wider, therefore smoother, and the rocks which were in the upper-course have been surpassed or have eroded away. Site 3 is also not as twisty as the previous two sites which may account to why the velocity there was faster.
The results show that Hyndburn Brook fits the Bradshaw Model.