Data Handling Coursework
Introduction
I am going to base my coursework on the Mayfield school database. I have written a hypothesis to show that my work is independent. I intend to use the autograph package for my graphs and calculations and also using Microsoft Excel to produce my scatter graphs. I am going to try and prove or disprove my hypothesis by using scatter graphs, Histograms and analyses. My samples of data can be found at the back of my investigation in an appendix.
To show how strong or weak the correlation is on each graph of Ks4 boys and girls I am going to state the R value, which will give me 95% confidence as to whether the correlation is strong or weak. To decipher whether the R value is above or below the minimum for strong correlation I will be using a Critical values for correlation coefficient table, which can be found at the back of the appendix.
Hypothesis: my hypothesis is that
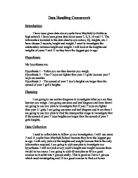
To investigate my first Hypothesis I must draw scatter graphs to compare height and weight at ks4 in girls and boys.
I am going to draw this first graph to see if there is any correlation between
The whole of my sample ( Yr 10+ 11 Students)
Graph to show correlation between height and weight in Ks4
As you can see from my graph that there is very little correlation and a few anomalys. I have drawn a trend line and got an r value of 0.153(3sf) which shows that there is virtually no correlation.
To continue my investigation I am going to separate the ks4 students into yr 10 males, yr 10 females, yr 11 males and Yr 11 females to see if there Is stronger correlation between the sexes and the year groups.
Graph to show correlation between height and weight in yr 10 males
The graph shows that there is no obvious correlation between height and weight in yr10 males. There are a few anomalies which suggests, that there could be an error in some of the data for the boys, For example there is a boy that weighs 9kg but is 1.60m tall! (we know that this is impossible). The r value I got for this graph is 0.293(3.sf) which again is weak correlation as the minimum r value for strong correlation is 0.336.
Introduction
I am going to base my coursework on the Mayfield school database. I have written a hypothesis to show that my work is independent. I intend to use the autograph package for my graphs and calculations and also using Microsoft Excel to produce my scatter graphs. I am going to try and prove or disprove my hypothesis by using scatter graphs, Histograms and analyses. My samples of data can be found at the back of my investigation in an appendix.
To show how strong or weak the correlation is on each graph of Ks4 boys and girls I am going to state the R value, which will give me 95% confidence as to whether the correlation is strong or weak. To decipher whether the R value is above or below the minimum for strong correlation I will be using a Critical values for correlation coefficient table, which can be found at the back of the appendix.
Hypothesis: my hypothesis is that
To investigate my first Hypothesis I must draw scatter graphs to compare height and weight at ks4 in girls and boys.
I am going to draw this first graph to see if there is any correlation between
The whole of my sample ( Yr 10+ 11 Students)
Graph to show correlation between height and weight in Ks4
As you can see from my graph that there is very little correlation and a few anomalys. I have drawn a trend line and got an r value of 0.153(3sf) which shows that there is virtually no correlation.
To continue my investigation I am going to separate the ks4 students into yr 10 males, yr 10 females, yr 11 males and Yr 11 females to see if there Is stronger correlation between the sexes and the year groups.
Graph to show correlation between height and weight in yr 10 males
The graph shows that there is no obvious correlation between height and weight in yr10 males. There are a few anomalies which suggests, that there could be an error in some of the data for the boys, For example there is a boy that weighs 9kg but is 1.60m tall! (we know that this is impossible). The r value I got for this graph is 0.293(3.sf) which again is weak correlation as the minimum r value for strong correlation is 0.336.