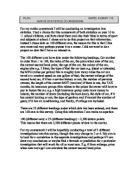
The 30 data which choose by calculator show below.
Preliminary Analysis:
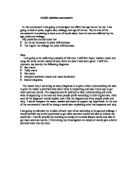
1. Mileage and asking price
According to the 30 data we selected, the graph above is produced by excel. As we can see from the graph above, the scatter plots indicates the general impression of the trend is positive. Although the graph is not strongly correlating due to limited samples, to some extent, it is suggested that mileage do influence the asking price of the cars. The formula of correlation should be used to prove whether the impression is right or wrong.
Correlation coefficient=n Σxy-(Σx)(Σy)/√(n Σx^2-( Σx)^2)(n Σy^2-( Σy)^2)=0.091652
To find the relationship between mileage and price, we should judge whether there is correlation or not. The coefficient of correlation should be compared with critical point. The critical point of 30 data is 0.3061 and obviously, 0.091652 is smaller than 0.3061. Therefore, no strong correlation is found between mileage and price. The correlation between mileage and price is weak probably due to some other factors which affect the asking price.
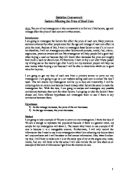
2. New price and Power
Same procedures will be in the regression analysis of the new price and power. By using the same examples, see the scatter spots below, the trend is quite positive as expected and a perfect correlation was found between power and new price. Again, as can be seen from the diagram below, a line of best fit was drawn.
From the graph, it is illustrated that power is a very important determinant of the new prices of cars. In order to test the relationship between new price and power, the correlation coefficient of these data has to be provided.
Correlation coefficient = n Σxy-(Σx)(Σy)/√(n Σx^2-( Σx)^2)(n Σy^2-( Σy)^2) =0.874814266
The coefficient of correlation between power and new price is 0.874814266, which means there is a strong relationship between power and new price because the result is greater than critical point 0.3061. From the best fit line y = 195.28x - 8243.4, our hypothesis can be testified.
Interpretation:
Let x be of the power cars, and y be the new price. Due to the common sense, x is absolutely greater than 0 because cars can not run without power. m is the change in x per unit increase in y. So, y=mx+c. Since m is positive here, price is increasing with the stronger power. When x equals 1, y=m+c. when x equals 2, y=2m+c. M is also the gradient of this trend line.
The regression equation is y = 195.28x - 8243.4
When the maximum power of the car (x) is 60 bhp, the new price of the car (y) is 195.28 – 8243.4 = £3473.4.
We can predict the new price with the maximum power by using the equation y = 195.28x - 8243.4
Conclusion:
To conclude, on analysing 30 sampled cars above, there are two main finding in this regression analysis:
Firstly, there is no correlation between the mileage and the asking price of used cars. Normally, people always build the higher mileage, the lower prices of the cars in their mind. However, we found that mileage has non-effect on the asking price. There are many reasons caused this result. Besides mileage, we should consider other factors such as weight, colour, interior, age, and engine capacity of the cars. So mileage is not the only determinant factor. Moreover, 30 samples are not enough to examine the relationship between asking price and the mileage accurately. Further more, among large amounts of cars we just focus on specific Japanese car group, which might not well represent the whole car industry.
Secondly, some significant correlation can be found between the current new prices and maximum powers of cars. For the relationship between current new price and maximum power, my investigation showed that there is a strong correlation. As a result, maximum power is an important determinant factor which influences the current new price. The stronger the maximum power, the higher the new price of the cars. However, due to the limitation of the samples and original data, the result cannot be to be representative. And there are also other factors are able to influence the price of cars, such as the colours, design, brand, taxation, fuel saving, and different agencies.
In spite of the limitations, we can still examine the general trend and predict the price of cars. Regression analysis might help car dealers to set the price and it might let the consumers gain some knowledge of price depreciation.