The aim of this investigation is to find out what influences the price of used cars (second hand). Used cars usually cost less than brand new cars, but this can be affected by hypotheses' such as mileage, age, colour, how it has been used etc.
Cherry Robinson 10/79 01/05/2007 Maths Coursework: Strand one: Aim: The aim of this investigation is to find out what influences the price of used cars (second hand). Used cars usually cost less than brand new cars, but this can be affected by hypotheses' such as mileage, age, colour, how it has been used etc. My investigation is to find out how these hypotheses affect a used cars' price. Hypotheses: For my example I have chosen to use the hypotheses: 1: age, 2: mileage, 3: weather it was expensive when new and 4: make. I have chosen these because I think they are most likely to affect the price of used cars. Sample: Out of my database of 150 I need to randomly select at least 30 samples. Samples are used representatively. They represent the whole database. We use samples because it would take too long to investigate every piece of data on the database, so we only investigate the samples. This is acceptable because they are selected randomly. The samples are very poor because there was a database of 150 and only 30 samples. The probability of getting a common car (i.e. Ford) is higher than less common cars (i.e. Mercedes) Testing hypotheses one. I'd expect to find negative correlation. But vintage cars might be worth more as they get older. Good condition old cars might be worth more when older. New cars that are written off might be worth less than others of
The factors that affect used car prices.
The factors that affect used car prices Planning In this experiment we are going to be collecting data in such a way so that it can show us which factors affect used car prices the most and also the least. To give us a vague idea of which were most popular amongst the general public each class member did a survey on every member of their household to see which factors of a car affect them most when purchasing such a vehicle. The results of which are shown below. Owners Age Colour Price Make MPG Air conditioning Tax MOT 5 29 3 3 22 9 1 6 7 3 2 5 4 =8 =8 As you can see from the table of results the most popular factor was age, however I believe that some of the data could be bias as the people giving the data may have been in a rush at the time or not have put much effort in. In this experiment I am going to try and use as many varying data collection methods to try and get the best of the data that I am going to use. Hypothesis 1 My first hypothesis is that the higher the first hand price is the higher the second hand price will be, I have recognised that this is quite an obvious hypothesis, however looking at this will be able to show us the anomalies and why they are anomalous and with this data we can see how we can improve our data collection. I am going to first use a scatter graph of new price against old price. I will use all data given to
Used Car PricesCourse Work Some of the factors which affect the price of a used car Age, Mileage, MPG, Colour, Engine Size
Used Car Prices Course Work Some of the factors which affect the price of a used car Age, Mileage, MPG, Colour, Engine Size, Fuel, Service History, Number of previous owners etc. I am going to concentrate on the following areas:- . Make - The manufacturers of the car e.g. ford, Mercedes etc. I think this affects the price of a used car because the price of the car when it is second hand depends on the popularity of that car, or whether the car is rare or not. For example I would expect a Bentley TurboR to go for more than a Ford Mondeo. 2. Age - I would expect older cars to go for less than newer ones because the older the car the less life it had left in it. 3. Mileage - I would expect a car with a lot of miles on it to be worn down a lot more than a newer one. Therefore I would expect it to go for a lot less than one with fewer miles on it. 4. Engine Size - I think that cars with a bigger engine have a tendency to be more appealing than cars with small engines. For example a 2.3 litre Volkswagen golf would go for more than a 1.6 litre Volkswagen golf 5. Colour - Sportier cars have a tendency to be painted fiery red or very intense bright yellow and they tend to appeal to younger boy racers. These tend to have very high insurance groups

Data Handling Coursework
Data Handling Coursework Maths Aim: To find out what factors affect the car prices and show how these factors affect it. Introduction: In this investigation I aim to find out the main factors which affect the price of a car. I also aim to find out if there is only one factor or a combination of factors affecting the price of the cars. Firstly I will decide which method I am going to use and which line of enquiry would provide me with the best results. I will include in my investigation all of my explanations, details, tests and theories. I will be using 39 cars either five or six from each make, depending on the availability of the cars for each make. To show my results clearly and make them easy to understand I will be recording my data in tables and expressing the results in various scatter graphs, box and whisker diagrams and cumulative frequency diagrams. The reason for which I am expressing my results in a series of ways is because I will then be able to interpret them easier and so draw conclusions. Hypothesis: As the age of the car increases the percentage depreciation in the price will also increase, meaning that the price of the car will decrease. The factors that play a major role in the pricing of the car are percentage deprecation, age, status of the car e.g. if it is new or second hand, the engine size, the mileage and finally the make. My first table will

Show that certain aspects of cars can determine the price of a second hand car.
Introduction In this investigation, I am going to show that certain aspects of cars can determine the price of a second hand car. In this investigation, I have made the following hypotheses: * The price of a new car will decrease the most in the first few years * There will be a positive correlation between the depreciation and the age * The make will influence the price of the second hand car * There will be a positive correlation between the engine size and the price of the second hand car * There will be a negative correlation between the mileage and the price of the second hand car * The colour will not influence the price of the second hand car * The fuel type will not influence the price of the second hand car The main variables in this investigation that could make a difference on my investigation are the following: * Make * Second hand price * Age * Engine size * Mileage To do this investigation properly, I will need to prove my hypotheses. This will be done by me collecting the data from the database that was issued to us at the beginning of this investigation. I have also looked at sources from websites and car magazines regarding the prices of second hand cars. Second hand car dealers, newspapers and the television also are very useful sources of information. These sources will be very useful as for example the car dealers, they would have a lot of
GCSE statistics coursework
GCSE statistics coursework In this coursework I am going to investigate the affect that age has on the car. I am going to look at price, engine size, mileage, and age of the car. By the end of the coursework I am aiming to have a set of results about how the cars are affected by the age, price and mileage. My prediction should show that * As the car increases its price will decrease * The higher the mileage the price will decrease. Plan I am going to be collecting a sample of 100 cars. I will find mean, median, mode and range for some certain makes of cars, from the data I have been given. I will then represent my data by the following diagrams * Bar charts * Tally charts * Pie charts * Standard deviation (mean and mean deviation) * Scatter diagrams. The reason why I am doing so many diagrams is to give a clear understanding and also to give the reader a pictorial view about what is happening, and also I must say to get more accurate results. The diagrams would maintain a clear understanding and show what is happening to the cars and what people prefer according to their engine size. After each of the diagram I would explain how I did the diagram and what people prefer and why. I would compare the mean, median and mode to support my hypothesis. At the end of the coursework I would be doing a conclusion explaining what has happened and why. I am going to
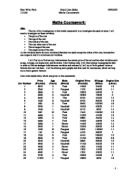
Maths Coursework: Car Sales
Maths Coursework: Aim: The aim of my investigation in this maths coursework is to investigate the used car sales. I will need to investigate on these variables: * The price of the cars * The age of the cars * The makes of the cars * The cost when new of the cars * The mileage of the cars * The engine sizes of the cars All the variables above are ratio variables (Numbers are used) except the makes of the cars, because that one is special and it's called nominal variables. I will first try to find out any links between the current price of the car and the other variables such as age, mileage, car engine size, and the make. After finding links, I will then attempt to progress the data in order to find out stronger links between variables and eventually I will try to find a general value or formula that can link them. I will be drawing some graphs and then look for conclusions, which can help me to find a general formula. Here is the results table, which was given in this coursework: Car Number Price (Pounds) Age (Years) Make (Brand) Original Price (Pounds) Mileage (Miles) Engine Size (Litres) 6970 3 Ford 1600 24000 .6 2 3350 7 Peugeot 7100 85000 .1 3 3995 6 Ford 3800 52000 2 4 5300 6 Vauxhall 6300 70000 2 5 6500 3 Fiat 8700 24000 .2 6 500 9 Vauxhall 8700 82000 .6 7 995 9 Ford 8500 02000 .8 8 3000 7
Regional distribution centre report.
Regional Distribution Centre Report Introduction: My company that I work for is currently expanding and has recently opened several new superstores on the outskirts of large urban areas. The existing distribution centers, which supply stores, are finding it difficult to meet the increased demand. So, the company has decided to set up a new distribution centre in an area, which has a mixture of old supermarkets and new superstores. Mileage: Mileage is one of the most important factors on this survey and research that I am doing and Prime thing that I have to look for is how far it is from the motorways and the supermarkets. In my opinion location C has got the best mileage and the one with the least mileage is D. Accessibility: Accessibility is not as important as mileage but it is still a convenient factor of the research and has to be considered very deeply. If the place has plenty of doors and garages, then it would be more convenient than a store with less doors and garages for the trucks or lorries to take our stock to the superstore. The best one again is location C and the worst one again is location D. But we have to remember that some locations are better at other things than at some things. Suitable Land: Land is vital for the company because we need lots of space for our staff to store the products from our regional distribution centre.6 acres would be good
How Business Works
GNVQ How Business Works For task one of my How Business Works assignment I am going to take the car manufacture Ford. For task one I will have to discuss and explain the history, aim, objectives and activities of Ford. * 1903 and the car manufacture Henry Ford Incorporated was established this company is now known as Ford they sold their first car a Model A to a dentist in Chicago. * 1908 Henry Ford introduces the Model T which was very popular. * 1913 the company began to trade overseas and Ford invented the assembly. The assembly which is used everywhere today. * 1922 the company is now doing extremely well and the Ford Company decides to buy Lincoln Motor Company. * In 1942 Henry Ford halts the out put of civilian cars because of world war two and shifts to military production. * 1947 and Henry Ford dies in his estate in Michigan but the company does not die with him but develops into one of the worlds largest car manufactures and operates globally. Ford also now developed or has taken over (Lincoln, Mercury, Mazda, Volvo, Jaguar, land rover and Aston martin.) Fords Aims With ford there would be a wide range of aims these aims would vary from benefiting the company to benefiting to shareholders and to reliability of there cars I am now going to list and explain some of these aims One of Ford biggest aims would obviously be to make a profit that was bigger

I will research the cars by putting the data I have been given into statistical charts, graphs and tables to analyse them. I will use a scatter graph to firstly look at how age affects all cars depreciation
Plan This piece of coursework has asked me to look at the prices of used cars and what makes their prices decrease. I think that the most important thing to do is to work out the depreciation of all of the 100 cars. I will do this first because I think that this will make the cars more easily comparable and put them all into percentage form. I will work out depreciation by using this equation. * D= C x100 O o D= Depreciation o C= Change in price o O= Original price This is the equation to work out the depreciation of a car. I will research the cars by putting the data I have been given into statistical charts, graphs and tables to analyse them. I will use a scatter graph to firstly look at how age affects all cars depreciation. This will have either a line or curve of best fit. If it is a straight line I can work out the equation of the line. The equation for this is: * Y=M><+C o Y= Depreciation o M= The gradient of the line o ><= Age o C= Where the line intercepts the y-axis This means I can approximately calculate the age of any car from only the depreciation and vice-versa. From the line I can also create a box plot and read the lower and upper quartiles, the inter quartile range, the median and the range. On this graph the lower quartile would show that a car loses a quarter of its value in however many years, the upper would show that the car