➔ Collecting Data
The following calculations will be performed during this investigation:-
-
Sampling - When one collects data one almost always has to take a sample from the population. One uses the sample to make judgments about the whole population, so it is important that the sample is chosen in a way that makes it reprehensive of the population.
-
Mean, Median and Mode - are all ways of describing a typical value. They are sometimes called measures of control tendency. Mean; is the average of the data. Medium; is the middle value of the data. Mode; is the most common data.
-
Standard deviation - While mean absolute deviation is a perfectly good measure of spread, it is not actually very widely used. Instead a different procedure is followed in which you square the deviations, rather than their absolute values, leading to the measure called standard deviation.
These calculations will help prove my investigation, and be useful because they will analyse the statistics data more quickly, easier and efficiently.
I will use diagrams such as:-
-
Scatter graphs - The line of best fit can be used to estimate an unknown value.
-
Histograms - Can be used to display continuous data, the area of the bar represents the class frequency; there are no gaps between bars unless there is an empty class.
-
Cumulative frequency - It is often helpful to display a large amount of data on a cumulative frequency graph.
-
Box & Whisker plots - The box is used to represent the central 50% of the data and the whiskers extend from the box to the smallest and largest values give an indication of the overall spread of the data.
-
Stem and leaf - They can be used to find quartiles, in particular the quartiles
To choose my sample I have decided to use random stratified sampling because this gives a fairer representation of the population. It also ensures there is no bias towards any year group or value. For my first hypothesis I am going to use a sample size of 30 students because I think that is a fair sample size for years 10 and 11 because it is not too small neither too large and I should be able to get a substantial number of students from each year into the data sample. Once I've worked out how many Year 10 students and how many Year 11 students I need. I will number each student from both of the two year groups separately. I will then use the random button on my calculator to pick out which of the Yr.10 students I will use. I will then repeat this method for the Yr.11 students. For my second, third and fourth hypothesis I am again going to use a sample of 20 as I will be using all of the students and a mixture of years, genders etc. Again I will use the random key on my calculator so every student will have an equal chance of getting picked. I can’t however use all the students as a sample because there is too much data involved, therefore the graph and charts I might do, would be harder to create.
Below is the total number of student’s year 10 and in year 11:-
I am going to use random stratified sampling simply by using this equation:-
This will therefore tell me the number of pupils I need in each year.
Hypothesis 1
The size of my sample will be 30.
Sample Size: 30 x 267 = 80.1 = 80
100
Year 10 Students: 137 x 80 = 41.04 = 41 Students
267
Year 11 Students: 130 x 80 = 38.95 = 39 Students
267
Hypothesis 2, 3 & 4
The size of my sample will be 30.
Sample Size: 20 x 267 = 53.4 = 53
100
All Students: 267 x 53 = 53 Students
267
Next I will use my calculator to randomly select Yr. 10 and Yr. 11 males and females. I will use the random number feature on the calculator. This is how it is done:-
- Press the button.
- Press the button with written on it. (this will give me a number between 0-1)
- Press the and
The calculation I will do on my calculator is:-
This should give me a number between 0-267. If however, the same number appears more than once, then I will redo it. I will repeat this method until all the samples have been taken. The data I will collect is going to be is called ‘secondary’ data because I didn’t go and collect it myself.
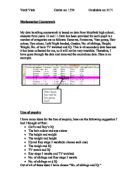
➔ My Sample
Hypothesis 1
Year 10
Year 11
Hypothesis 2, 3 & 4
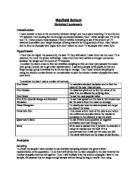
➔ Calculations
Hypothesis 1
Frequency Table for Height
Year 10
Year 11
Frequency Table for Weight
Year 10
Year 11
From my findings using Microsoft Excel I noticed that the mean height for year 11 is higher but only slightly then year 10 mean height so my hypothesis was correct but the difference between the heights means is very small.
Also my hypothesis said that year 11 are heavier is incorrect because the average weights of year 10 and year 11 are nearly the same with year 10 being slightly higher.
Using Microsoft Excel I worked out the standard deviations for year 10 and year 11 heights which are 0.11m and 0.13m this means that they are nearly the same in terms of heights range or variability.
Looking at the weights the standard deviation for year 11 weights is wider than that for year 10 weights so we can say year 11 weights are more spread out.
Hypothesis 2
This correlation coefficient is actually positive and close to 1 which means there is positive correlation between IQ and average Sats scores. This is also shown by my scatter graph above. This means my hypothesis which said: "the higher the intelligence quotient (IQ) the higher the Key Stage 3 Sats Results" was correct.
Hypothesis 3
This is a very low correlation coefficient and it is closer to 0 than to 1 therefore there is very, very low or no correlation between TV hours watched per week and IQ. Which means my hypothesis which said: "the more hours of TV watched per week, the lower the intelligence quotient (IQ)" was wrong. This fact is also shown in my graph above which also shows no correlation.
Hypothesis 4
This is a very low correlation coefficient and it is closer to 0 than to -1 therefore there is again very, very low or no correlation between TV hours per week and weight. Which means my hypothesis which said: "The more hours of TV watched per week, the more the student weights" was wrong. This fact is also shown in my graph above which also shows no correlation.
➔ Conclusion
My hypothesis that year 11 students are taller and heavier than year 10 students more has been proved correct through this investigation. There is a good but not entirely a strong correlation. My hypothesis that the higher the IQ the higher the average Sats result was also proven correct as this showed a strong correlation. However, my hypothesis that the more hours of TV watched per week, the lower the intelligence quotient (IQ) and the more hours of TV watched per week, the more the student weights were both shown to be incorrect, as both of these are very, very low correlation or no correlation at all. This may be because the figures given were incorrect or there wasn’t enough samples taken.
➔ Evaluation
In order to make this investigation more accurate and reliable I could have used a much bigger sample. Although this would involve a lot more time being spent and more calculations, the accuracy of the investigation would be much better and this may show and even stronger correlation and even proven my entire hypothesis correct. However, I have only looked at a sample of the data, the sample was taken randomly and I have not been bias at any time throughout the investigation so I do believe that my conclusion is correct and that there is a strong correlation between height and weight of pupils in year 10 and in year 11 and between the IQ and Average Sats Scores.
I could also carry on the investigations by going into the genders by investigating that year 11 boys are taller and heavier than year 10 boys.
Overall as a conclusion I have fulfilled 50% of my aim and have done so fairly with relatively accurate results, overall the investigation was quite successful.