CONCLUSION
Tall people usually weigh more than shorter people if not influenced by exercise.
BAR CHARTS OF HEIGHT AND WEIGHT
PIE CHARTS
Height
MEAN
182+187+178+181+194+181+182+187+186+180+173+178+185+172+187+ 183+180+184+175+179+184+179+172+183+179+185+188+184+187+185
30
182
EXTREME VALUES = 194 cm
MODE
187 as it appears 4 times
MEDIAN
172,172,173,175,178,178,179,179,179,180,180,181,181,182,182,183,183,184,184,184,185,185,185,186,187,187,187,187,188,194
182.5 = 182+183 ÷ 2 = 182.5
OBSERVATION
As we can see that the answer is exact and was very easy to calculate. However the mean was affected by the extreme value which in this case was 194 cm. The most height that appeared in the data was 187 as there were four students of that height. The median gave us the answer as a decimal which is a disadvantage but we can observe that the median was very close to the mean.
CONCLUSION
The average height (mean) of a student is 182 cm and the height that appeared most was 187 cm. The median was 182.5.
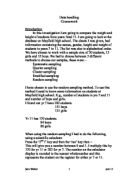
SIMPLE DATA IN TABLES OF HEIGHT
GROUPED DATA IN TABLES OF HEIGHT
OBSERVATION
Here we observe that just below one third of the students are in the 170's cm in height. Most of the students are in the 180's cm and only one person in the 190's cm.
HISTOGRAM OF HEIGHT
LOWER QUARTILE = 179cm
UPPER QUARTILE = 185.5cm
MEDIAN = 182.5cm
INTERQUARTILE RANGE = 6.5cm
OBSERVATION
By finding the interquartile range the disadvantage of extreme values affecting the mean or median so the interquartile range gives us the range of the middle half of the data.
CONCLUSION
The interquartile range is in this case 6.5 cm.
Weight
MEAN
68.4+75.7+45.8+66.3+82.8+75.8+55.1+72.9+69.8+68.3+58.0+62.7+65.0+48.7+71.1+63.5+72.8+63.0+52.6+54.5+68.2+63.3+60.9+67.0+66.1+ 73.4+75.3+65.8+76.3+64.6
30
65.79 kg
EXTREME VALUES = 82.8 kg
MODE = 60's
MEDIAN
45.8,48.7,52.6,54.5,55.1,58.0,60.9,62.7,63.0,63.3,63.5,64.6,65.8,66.1,66.3,67.0,68.2,68.3,68.4,69.8,71.1,72.8,72.9,73.4,75.5,75.7,75.8,76.3,82.8
66.2 = 66.1 + 66.3 ÷ 2 = 66.2 kg
OBSERVATION
As we can see that the answer is exact and was very easy to calculate. However the mean was affected by the extreme value which in this case was 82.8 kg. There was no mode as everyone's weight was different. The median gave us the answer as a decimal which is a disadvantage but we can observe that the median was very close to the mean.
CONCLUSION
The average weight (mean) of a student is 65.79 kg and the median was 182.5. There was no mode obtained.
SIMPLE DATA IN TABLES OF WEIGHT
GROUPED DATA IN TABLES OF WEIGHT
LOWER QUARTILE = 62.7kg
UPPER QUARTILE = 72.8kg
MEDIAN = 66.2 kg
INTERQUARTILE RANGE = 10.1kg
OBSERVATION
Here the interquartile range was 10.1 kg which shows that this data is more spread than the data of height. The extreme value which in this case was 82.8 kg was avoided by using the interquartile range.
CONCLUSION
The interquartile range here is 10.1 kg.
HISTOGRAM OF WEIGHT