I will use diagrams such as;
-
Scatter graphs – The line of best fit can be used to estimate an unknown value.
-
Histograms – Cane be used to display continuous data, the area of the bar represents the class frequency; there are no gaps between bars unless there is an empty class.
-
Cumulative frequency – It is often helpful to display a large amount of data on a cumulative frequency graph.
-
Box plots & Box and whiskers – The box is used to represent the central 50% of the data and the whiskers extend from the box to the smallest and largest values give an indication of the overall spread of the data.
-
Stem and leaf – They can be used to find quantiles, in particular the quartiles.
Others;
-
Quartiles – Of an ordered set of data are such that 25% of the observations are less than or equal to the first quartile (Q1), 50% or less than or equal to the second quartile (Q20 and 75% or less than or equal to the third quartile (Q3).
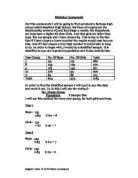
The relationship between height and weight of males and females of year 7.
From the data (see data sheet) I have come up with:
For Year 7 Males and Females together;
Raw Data:
- Number in sample: 50
- Mean: 1.5422
- Standard deviation: 0.0884373
- Range: 1.41
- Lower Quartile: 1.4775
- Medium: 1.555
- Upper Quartile: 1.61
- Semi Inter Quartile Range: 0.06625
Grouped Data:
- Total Frequency: 50
- Mean: 1.05
- Standard deviation: 0.0873212
- Modal Class: 1.6-
- Lower Quartile: 0.986111
- Medium: 1.06
- Upper Quartile: 1.11875
- Semi Inter Quartile Range: 0.0663194
Males:
Raw Data:
- Number in sample: 30
- Mean: 1.53633
- Standard deviation: 0.0900179
- Range: 0.37
- Lower Quartile: 1.4675
- Medium: 1.545
- Upper Quartile: 1.6
- Semi Inter Quartile Range: 0.06625
Grouped Data:
- Total Frequency: 30
- Mean: 1.045
- Standard deviation: 0.087178
- Modal Class: 1.45-
- Lower Quartile: 0.979167
- Medium: 1.05
- Upper Quartile: 1.1125
- Semi Inter Quartile Range: 0.0666667
Females:
Raw Data:
- Number in sample: 20
- Mean: 1.551
- Standard deviation: 0.0852584
- Range: 0.33
- Lower Quartile: 1.485
- Medium: 1.585
- Upper Quartile: 1.6
- Semi Inter Quartile Range: 0.06625
Grouped Data:
- Total Frequency: 20
- Mean: 1.0575
- Standard deviation: 0.0869986
- Modal Class: 1.6-
- Lower Quartile: 1
- Medium: 1.075
- Upper Quartile: 1.125
- Semi Inter Quartile Range: 0.0625
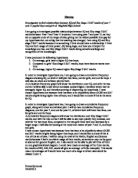
Height for Year 7 Males and Females
The histogram above shows a sample of males and females taken from a sample of 50 (simple random sample) showing their height.
The cumulative frequency graph above also shows a sample of males and females taken from a sample of 50 (simple random sample) showing their height.
The box and whisker diagram above shows another comparison of height between males and females in year 7.
The graphs above show that my first prediction was correct, that was males are taller than females. The histogram shows the males are taller but just by a little as on the 1.1 bar the males and females are equal. But the males are smaller than the male as the cumulative frequency graph shows. The males start below than the females but then gradually they get taller whilst the females have a more relaxed growth rate. This may be due to the genetic pattern in females. The box and whisker diagram show that the males overall are taller, but the females have a bigger lower quartile and a bigger mean than the males. But the males have a bigger upper quartile, (see statistics above). The results show me what I expected but the females have a faster growth rate than male but this is only portrayed in the cumulative frequency graph as the females smallest female is taller than the males smallest male. There are no anomalous results such as a small fat male or a tall thin female. The results show me what I expected and that was the males are heavier than the females.
Weight for Year 7 Males and Females
The histogram above shows the distribution of weight between year 7 males and females.
The histogram above also shows the distribution of weight between year 7 males and females.
The box and whisker diagram above shows the weight of year 7 males and females.
All three graphs above show that males are heavier than females. The histogram shows that the females are nowhere on the graph to be seen, as the males lightest male is the females average weight. As the histogram shows they’re to be a large gap at the begging of the graph. This indicates that the male’s lightest male is heavier than the female’s mediocre female. The cumulative frequency graph clearly states that the males are heavier as the red line (male) is above the blue line (female) from the start. They both progress at the same rate but the females line progresses slower and at the end the males line still goes a little up but the females doesn’t that just straightens out. The box and whisker diagram shows the males and females to have an equal mean but the males have a larger lower quartile range and a larger upper quartile range. The male’s quartiles are approximately double the female’s quartiles.
The relationship between two sets of Key Stage 2 results, (Maths and Science).
From the data (see data sheet) I have come up with:
Maths for year 7 Males and Females together;
Raw Data:
- Number in sample: 50
- Mean: 4.16
- Standard deviation: 0.611882
- Range: 3
- Lower Quartile: 4
- Medium: 4
- Upper Quartile: 5
- Semi Inter Quartile Range: 0.5
Grouped Data:
- Total Frequency: 50
- Mean: 4.16
- Standard deviation: 0.611882
- Modal Class: 4-
- Lower Quartile: 3.71667
- Medium: 4.13333
- Upper Quartile: 4.60714
- Semi Inter Quartile Range: 0.445238
The histogram above shows the levels gained by males and females at key stage 2 maths.
The histogram above also shows the levels gained by males and females at key stage 2 maths.
The box and whisker diagram above shows key stage 2 maths for males and females in year 7.
Science for year 7 Males and Females;
Raw Data:
- Number in sample: 50
- Mean: 4.3
- Standard deviation: 0.538516
- Range: 2
- Lower Quartile: 4
- Medium: 4
- Upper Quartile: 5
- Semi Inter Quartile Range: 0.5
Grouped Data:
- Total Frequency: 50
- Mean: 4.3
- Standard deviation: 0.538516
- Modal Class: 4-
- Lower Quartile: 3.83871
- Medium: 4.24194
- Upper Quartile: 4.76471
- Semi Inter Quartile Range: 0.462998
The histogram above show the key stage 2 results of science for the year 7 pupils of Mayfield High School.
The cumulative frequency graph above shows the science results for key stage 2.
The box and whisker diagram above the results for science in the key stage 2 examination.
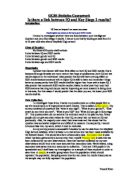
Maths and Science for year 7 Males and Females together
The histogram above shows the levels gained for key stage 2 maths and science for males and females.
The cumulative frequency graph above also shows the levels gained for key stage 2 maths and science for males and females.
The box and whisker diagram above represents the relationship between two sets of key stage 2 results (maths and science) for year 7.
The second histogram above shows that level 4 is gained the most by the pupils of Mayfield High School. Level 5 is gained by a third of the pupils and less than 10 pupils gain level 3.
The maths and science results are equal as you can see from the histogram. The level 4 and level 5 are not the same as. This can be clearly seen from the cumulative frequency graph, as more pupils gained a level 3, 4 and 5 than science. So my first prediction was correct and that was that more pupils will gain a level in maths than science. The box and whisker diagrams are both the same for each subject as the diagram clearly shows. This maybe because the levels gained by the pupils are close, so the box and whisker diagrams will be the same.
The relationship between IQ and Key Stage 2 (English) results in year 7.
From the data (see data sheet) I have come up with:
I.Q. for year 7 Males and Females together;
Raw Data:
- Number in sample: 50
- Mean: 101.88
- Standard deviation: 4.21255
- Range: 20
- Lower Quartile: 100
- Medium: 101
- Upper Quartile: 105.25
- Semi Inter Quartile Range: 2.625
Grouped Data:
- Total Frequency: 50
- Mean: 102.755
- Standard deviation: 4.17246
- Modal Class: 100-
- Lower Quartile: 100.329
- Medium: 103.553
- Upper Quartile: 106.776
- Semi Inter Quartile Range: 3.22368
The histogram above shows males and females I.Q. for year 7.
The cumulative frequency graph above represents year 7 males and females I.Q. levels for Mayfield High School.
The box and whisker diagram above shows the I.Q. level for 50 males and females in year 7.
English for year 7 Males and Females together;
Raw Data:
- Number in sample: 50
- Mean: 4.2
- Standard deviation: 0.632456
- Range: 3
- Lower Quartile: 4
- Medium: 4
- Upper Quartile: 5
- Semi Inter Quartile Range: 0.5
Grouped Data:
- Total Frequency: 50
- Mean: 4.2
- Standard deviation: 0.632456
- Modal Class: 4-
- Lower Quartile: 3.73214
- Medium: 4.17857
- Upper Quartile: 4.71875
- Semi Inter Quartile Range: 0.493304
The histogram above represents the key stage 2 results for English gained by year 7 pupils.
The cumulative frequency graph above shows key stage 2 English for males and females at Mayfield High School.
The box and whisker diagram above shows key stage 2 results for males and females in year 7.
The histogram shows that most pupils in year 7 gain a level 4 than a level 3 or 5. This may be because it is the average results for key stage 2 and most pupils in most schools are average. The cumulative frequency graph shows there to be a small increase when it get to 3 (looking at the ‘X’ axis) and then it slowly increases when it gets to 4 and then the line slows down increasing when it gets to 5. The box and whisker diagram shows the whiskers extending to the 3, as it is the smallest value. There is no mean as the raw data and the grouped data means are the same so they both cancel each other out. There is only a very minute whisker going to 5 as the raw data upper quartile is almost 5 and the grouped data upper quartile is 5(see statistics above). The I.Q. levels may reflect on the English marks as the most of the I.Q. marks are in the hundreds and not in the nineties or below. The I.Q. histogram clearly shows that most pupils have a high I.Q. 100+. The cumulative frequency graph is hard to analyse as it juts out in places. This maybe because the males and females of year 7 have the same I.Q. levels so it tries to straighten out, but then another male or female has a higher I.Q. level so then it has to up gain etc. The box and whisker diagram shows the whisker approximately being an exact length this is because the raw data and grouped data, upper and lower quartiles are almost the same; they are only a few decimal places out. The box and whisker diagram is negative as the mean in leaning towards the lower quartile whisker.
In conclusion my results have stated that the year 7 males are taller than year 7 females this may change later in the years. Year 7 males weigh more than year 7 females, I think this won’t change in the coming years for the females as the, as the females take care of there weight when they are older than males do. Also maths as a whole in key stage 2 provides better results than science as a hole as maths is easier than science, this may be because maths doesn’t need that much thinking thought than science. For example, if one wanted to become a doctor and that one is performing surgery he will have to think carefully where to cut open the patient, if he does it wrong then that cut may be fatal. All of my results are what I expected as they all support my predictions. All the data collected was right as a simple random sample was taken, and that was all the data was put in a hat and pulled out one by one. I think the data that I had was just about enough as 50 pupils (30 males and 20 females) were chosen this way and there was no problems with the data. The techniques used were correct as they displayed the data correctly and there were no problems in drawing the graphs and diagrams etc. The expectations that I made are all realistic as they say the truth about the pupils, for example, I said that males would weigh more than females and males will be taller than females, and that is exactly what happened. The results and expectations were based on real life, as that is how the data was gained from real life pupils. There was no bias towards the results, which is why I did a simple random sample. I could have compared more years for the I.Q. levels and weigh and height. This would give me a good realistic comparison of the years, and see if females look after their weigh in the coming years. From looking at all of the data some of the data was looking a bit odd this may either be a typing error (human error) or the pupil has a defect in them. I was lucky not to get them in my sample of 50. I should further my data by taking a low sample size and see what would happen then, and also share the data.