Histogram of Boys IQ
Histogram of Girls IQ
By looking at the two graphs I can tell there is a contrast between the Boys and Girls IQ. But to make it even more detailed I will need to make both sets of data on the same graph. Making a frequency polygon will make the comparison a lot clear.
Frequency Polygon for Boys and Girls IQ
This graph supports my hypothesis. It shows that there are boys that have an IQ over 120, whereas there are no girls which have an IQ over 120. Similarly there are only girls which have an IQ of 80 and 90 interval. By looking at the graph I am able to work out the modal group. But however it is not as easy to work out the mean, range and medium. So to do this I have decided to make a stem and leaf diagrams. Then I will be able to read each individual IQ, rather than group IQ’s.
Boys
Stem Leaf Frequency
80 6,9,9 3
90 8,6,6,7,7,0,8 7
100 2,4,0,0,4,2,1,0,4,6 10
110 9,2,2,0,7,6,2,9 8
120 8 1
130 0
Girls
Stem Leaf Frequency
80 7,8 2
90 1,6,8,4,7,4,0,8 8
100 3,7,1,8,7,5,2,0,3,1,6,7 10
110 16,12,14,16,12,13, 6
120 0
130 0
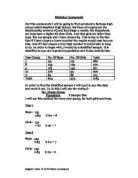
This is a table with the results for boys and girls:-
(The figures I have got have been rounded to the nearest figure)
Despite most of the girls and boys having the majority of their IQ’s in the 100-110’s. 12 out of 30 girls are in this category. Whereas only 11 out of 30 boys. This is easily seen.
My evidence shows the average boy is brighter by 5 than of the average girl. Also another thing my evidence shows is that the boys IQ is more spread out with 42 as its range rather than the girls which has 29 as its range.
Histogram of Boys Heights
Histogram of Girls Heights
As with the IQ I can see the obvious differences between the girls and the boys heights. But the data is not shown in a way in which I can compare it, so that is why I am going to put the two sets of data into one frequency polygon
Frequency Polygon of Boys and Girls Heights
This shows that the girls heights only reach up to 190 whereas the boys heights go up to 200.
Boys
Stem(cm)Leaf Frequency
120 0
130 0
140 2,8,8 3
150 0,0,3,3,4,4,7,9,9 9
160 0,0,0,2,2,3,8,8 8
170 1,2,2,3,5,5,7,7 8
180 2 1
190 1 1
Girls
Stem(cm) Leaf Frequency
120
130 9 1
140 9 1
150 0,2,3,4,5,6,7,8,8,9 9
160 0,0,1,1,2,2,5,5,8 8
170 0,0,2,2,3,5,6 6
180 0 1
190
Now with these more even detailed results, I can now see the exact frequency of each of the people heights, into groups. As with graphs you cannot actually tell. It could be that point in the group 140<H<150 could be 140cm. So I feel it is good to see what exact points you are dealing with. I can now work out the mean, median and range of the data. The results are as follows:-
From this results my modal for the girls is actually higher than the modal of the boys. This is very visible on my frequency polygon. As the girls line reaches higher that the boys line. This not actually does follow my hypothesis because just because the modal is higher does not mean the group which has the greatest height. But the median height is actually the same for both girls and boys. But when it is the range of results similarly to the IQ the boys’ range is higher than the girls. It has the difference of 8 between them. Of what I have done , my conclusion are only based on a random sample of thirty boys and 30 girls. So they are not 100% accurate. And I will sometime extend my sample later in order to make it more accurate. I feel now that it is time for me to work out the quantities and medians of the both sets of data. As this will be grouped data so I can make stem and leaf diagrams.
So to do this I am going to produce cumulative frequency graphs as this is very good when comparing grouped continuous data. And I can make a further conclusion when comparing the heights and the IQ results separately. I am also going to make box and whisker diagrams on the same curve because this will allow me to find the median, upper and lower quartiles and inter-quartile ranges much easier. I am firstly going to look at the IQ and make the best match possible I am going to put boys and girls mixed on one graph.
Box And Whisker Diagrams
A box and Whisker diagram show the spread of data. It also shows the upper quartile, lower quartile and the inter-quartile range. The median is the middle number. The upper quartile is the value three quarters of the data. And one quarter is above. The lower quartile is 1 one quarter of the data set. And three quarters are above. The inter quartile range is the difference in value between the upper quartile and the lower quartile values.
Cumulative Frequency Table
Boys
Cumulative Frequency Table
Girls
My two curves above show that it goes towards the higher IQ’s for the boys and girls. From my box and whisker diagrams I have worked out: -
The results I have do agree with my hypothesis that boys have a higher IQ than girls. Because the lower quartile is higher by two than the girls which is 87, also the upper quartile is higher and the inter quartile range. And also the mean for the boys is higher by 5 than the girls IQ.
Box and Whisker diagrams and Cumulative Frequency For heights
Boys
Girls
These results show a trend for the higher heights for the boys and girls. As I did with my IQ box and whisker diagram I have got the following information: -
These results do not follow my prediction that girls are taller than boys. Because the lower quartile for the boys is higher than the girls. Also it is the same with the Upper Quartile and the inter-Quartile range. The mean of the boys is higher than the girls. From all of the evidence I have collected so far I have found out that the boys IQ is higher than the girls, which is what I originally predicted. And I have found out that the boy’s heights are taller than the girls. And this helps me conclude my original hypothesis Boys have a higher IQ than boys and Girls are taller than boys.
When looking at my cumulative frequency graphs for IQ and Heights I can say they are kind of the same. And there is no relationship between the IQ and Height as of yet. I am now going to extend my investigation so that IQ and Height can be related. The best way to do this is to make a scatter diagram. I am going to do girls and boys separately because it will make a stronger correlation. The good thing about scatter diagrams is they allow me to compare the correlations of two graphs. And get the line of best fit for each girls and boys.
Boys Scatter Diagram Of IQ and Height
This graph shows a positive correlation between the height and weight, and all the points seem to fit close to the line of best fit.
Girls Scatter Diagram Of IQ and Height
This graph also shows a strong correlation and this correlation is about the spread for both the boys and the girls. Most of the points on the graph are mostly next to and near each other. This is round about the same on the boys graph as well. Since both my lines of best fit are straight the line of the equation would obviously be y=mx+c. Where y would be the IQ and X be the height in centimetres. This means I could predict results.