RESULTS
Influence Of Shading: North Facing.
Influence Of Shading: South Facing.
Graph Showing The Effect Of Light Intensity (North Facing) On Number Of Dog’s Mercury Shoots.
Graph Showing The Effect Of Light Intensity (North Facing) On Shoot Height Of Dog’s Mercury
Graph Showing The Effect Of Light Intensity On The Number Of Dog’s Mercury.
Graph Showing The Effect Of Light Intensity On The Mean Height Of Dog’s Mercury.
STATISTICAL ANALYSIS
SPEARMAN'S RANK CORRELATION
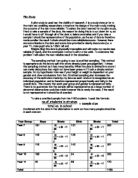
Spearman's Rank Correlation is a technique used to test the direction and strength of the relationship between two variables. In other words, it’s a device to show whether any one set of numbers has an effect on another set of numbers. It uses the statistic Rs, which falls between -1 and +1.
Using the formula
Where, n is the number of ranks you have. Subtract the two sets of ranks to get the difference d. Square the values of d. Add the squared values of d to get Sigma d2.
North Facing
The null hypothesis is stated that:
"There is no relationship between the light intensity and the number of plants."
The Rs value falls between -1 and -0.5, therefore there is a strong negative correlation between the light intensity and the number of plants.
The null hypothesis is stated that:
"There is no relationship between the light intensity and the height of plants."
The Rs value falls between -1 and -0.5, therefore there is a strong negative correlation between the light intensity and the height of plants.
South Facing
The null hypothesis is stated that
"There is no relationship between the light intensity and the number of plants."
The Rs value falls between 0.5 and 1, therefore there is a strong positive correlation between the light intensity and the number of plants.
The null hypothesis is stated that
"There is no relationship between the light intensity and the height of plants."
The Rs value falls between 0.5 and 1, therefore there is a strong positive correlation between the light intensity and the height of plants.
T-TEST
To see if there is a difference in the data between the two sites, north facing and south facing, a t-test is carried out.
The formula for a t test is:
The null hypothesis is stated that:
"There is no difference in height of Dogs mercury between the two sets of data."
The probability of this result, assuming the null hypothesis, is 0.078. Since this is >5% we accept the null hypothesis that there is no significance difference between the data.
The null hypothesis is stated that:
"There is no difference in the number of Dogs mercury between the two sets of data."
The probability of this result, assuming the null hypothesis, is 0.331. Since this is >5% we accept the null hypothesis that there is no significance difference between the data.
EVALUATION
From the results obtained it can be said that on the north-facing site there is an inverse relationship between light intensity and the height, and number, of Dog’s mercury shoots. This is as expected as Dog’s mercury tends to grow in woodland area and as the light intensity decreases it grows towards the sun, and further apart from other plants, to maximise absorption of light.
However, on the south side the results are not as expected. As light intensity increases so does the number of plants. The canopy cover may be a reason for this, because the site chosen, although being in the south, had a lot of canopy cover from surrounding areas, which blocked the light. The north-facing site was in an opening and on a hill, therefore got more light.
The t-test suggests that there is no relationship between the two sites therefore it is dismissible.
This investigation could be improved by having repeated quadrats samples in relatively the same area, or by having samples at certain intervals.
An extension of this investigation could involve taking into account the area of the leaf.