For my maths coursework on Mayfield high school I have chosen to investigate the relationship between height and weight of the students. I will be using random sampling
For my maths coursework on Mayfield high school I have chosen to investigate the relationship between height and weight of the students. I will be using random sampling to choose 30 boys and 30 girls from a total of 1183 students. I am using random sampling because there are to many students to analyse them all. I will be using the calculator to generate random numbers between 1 and 1183. This should give a fair group to analyse. However the calculator may give to many girls in year 11 or too many boys in year 7, and this would make it an unfair group from the whole school. If I already had the 30 boys and the calculator kept giving numbers of boys I would ignore it until I got a number for a girl. I will be randomly choosing 6 boys and 6 girls from each year since there are five years this will give me a total of 60 pupils.
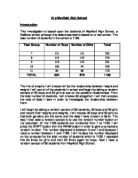
The reason that I chose to investigate the relationship between height and weight is because; I thought that these two lines of inquiry would have some positive correlation between them. I also thought it would give quite a lot of results when researched.
On the next page is a table of all of the students I have picked what year they are in and their height and weight.
Boys
Girls
Year
Height (m)
Weight (kg)
Height (m)
Weight (kg)
7
.47
41
.48
39
7
.5
40
.51
50
7
.62
49
.45
41
7
.61
56
.66
45
7
.57
48
.53
47
7
.48
40
.52
33
8
.65
45
.75
72
8
.2
38
.5
45
8
.55
38
.73
62
8
.72
51
.64
44
8
.61
54
.7
50
8
.25
61
.52
45
9
.7
47
.57
38
9
.7
42
.58
55
9
.74
57
.57
52
9
.68
65
.51
48
9
.71
68
.71
59
9
.7
48
.4
41
0
.9
70
.73
51
0
.77
59
.47
45
0
.8
59
.53
51
0
.73
50
.56
45
0
.75
57
.53
48
0
.8
63
.6
50
1
.68
50
.67
52
1
.79
72
.63
47
1
2
86
.61
54
1
.83
75
...
This is a preview of the whole essay
41
0
.9
70
.73
51
0
.77
59
.47
45
0
.8
59
.53
51
0
.73
50
.56
45
0
.75
57
.53
48
0
.8
63
.6
50
1
.68
50
.67
52
1
.79
72
.63
47
1
2
86
.61
54
1
.83
75
.61
45
1
2
60
.65
54
1
.65
45
.6
65
Below are frequency tables of height for boys and girls
Boys
Height, h (m)
Tally
Frequency
.20<=h<1.30
2
.30<=h<1.40
0
.40<=h<1.50
2
.50<=h<1.60
3
.60<=h<1.70
7
.70<=h<1.80
0
.80<=h<1.90
3
.90<=h<2.00
2.00<=h
2
Girls
Height, h (m)
Tally
Frequency
.20<=h<1.30
0
.30<=h<1.40
0
.40<=h<1.50
4
.50<=h<1.60
2
.60<=h<1.70
9
.70<=h<1.80
5
.80<=h<1.90
0
.90<=h<2.00
0
2.00<=h
0
Below are frequency tables of weight for boys and girls
Boys
Weight, w (kg)
Tally
Frequency
30<=w<40
2
40<=w<50
0
50<=w<60
9
60<=w<70
5
70<=w<80
3
80<=w<90
Girls
Weight, w (kg)
Tally
Frequency
30<=w<40
3
40<=w<50
3
50<=w<60
1
60<=w<70
2
70<=w<80
80<=w<90
0
Below are stem and leaf diagrams for the height of boys and girls.
Boys Height
Stem (m)
Leaf
Frequency
.2
0,5
2
.3
0
.4
7,8
2
.5
0,5,7
3
.6
,1,2,5,5,8,8
7
.7
0,0,0,1,2,3,4,5,7,9
0
.8
0,0,3
3
.9
0
2
0,0
2
Girls Height
Stem (m)
Leaf
Frequency
.2
0
.3
0
.4
0,5,7,8
4
.5
0,1,1,2,2,3,3,3,6,7,7,8
2
.6
0,0,1,1,3,4,5,6,7
9
.7
0,1,3,3,5
5
.8
0
.9
0
2
0
Boys Weight
Stem (kg)
Leaf
Frequency
30
8,8
2
40
,0,0,2,5,5,7,8,8,9
0
50
0,0,1,4,6,7,7,9,9
9
60
0,1,3,5,8
5
70
0,2,5
3
80
6
Below are stem and leaf diagrams for the weight of boys and girls.
Girls Weight
Stem (kg)
Leaf
Frequency
30
3,8,9
3
40
,1,4,5,5,5,5,5,5,7,7,8,8
3
50
0,0,0,1,1,2,2,4,4,5,9
1
60
2,5
2
70
2
80
0
Below are the frequency graphs for height for boys
This bar chart shows that most of the boys are 1.70m to 1.80m. However there are 2 boys who are extremely short compared t the rest of them, there are also 2 boys who are very tall
Below are the frequency graphs for height for girls
All of the girls are in the category of 1.40m to 1.80m. There are no girls that are very short and neither are there any girls that are very tall, out of the 30 that I picked. 12 of the girls are between 1.50m to 1.60m.
Below is a dual bar chart comparing the height of boys and girls
Using the dual bar chart we can compare the differences in height between boys and girls. Although there are more girls that are in the height range of 1.40m to 1.70m, when the height range increases the number of girls in that range decreases. There are no girls that are above 1.80m. Using the bar chart we can say that on average boys are taller than girls.
Below is a Frequency polygon chart
This frequency polygon chart gives us roughly the same information as the duel bar chart does because it also compares the difference in height between boys and girls.
Mean height
The mean height for boys = 1.672m
The mean height for girls = 1.584m
Modal height
The modal height for boys = 1.70m<=h<1.80m
The modal height for girls = 1.50m<=h<1.60m
Median height
The median height for boys = 1.70m
The median height for girls = 1.59m
Range of height
The range of height for boys = 0.8m
The range of height for girls = 0.35m
Height
Mean
Mode
Median
Range
Boys
.672m
.70m<=h<1.80m
.70m
0.8m
Girls
.584m
.50m<=h<1.60m
.59m
0.35m
All four of the measures mean, mode, median and range are greater for boys. However there are a small number of boys who are shorter than all of the girls. The evidence in general suggests that the heights of the boys are greater than that of the girls.
Below are the frequency graphs for weight for boys
This bar chart shows us that most of the boys weight 40kg to 50kg. Only one boy weighs in the 80kg to 90kg range this may have been an odd result. This will affect the mean and mode if it was an odd result.
Below are the frequency graphs for weight for girls
The bar chart shows us that most of the girls are in the 40kg to 50kg range. There is one girl that is in the 70kg 80kg range this may be an odd result.
Below is a dual bar chart comparing the weight of boys and girl
Using the dual bar chart we can make comparisons between the weight of the boys and the girls. There are more girls that weigh between 30kg to 60kg than there are boys. However when the scale increases the number of girls decreases. Using the bar chart we can say that generally boys weigh more than girls do.
Below is a Frequency polygon chart
The frequency polygon above gives the same information as the dual bar chart does because it also compares the difference in weight between the boys and the girls.
Mean weight
The mean weight for boys = 54.46667kg
The mean weight for girls = 49.1kg
Modal weight
The modal weight for boys = 40kg<=w>50kg
The modal weight for girls = 40kg<=w>50kg
Median weight
The median weight for boys = 55kg
The median weight for girls = 49kg
Range of weight
The range of weight for boys = 48kg
The range of weight for girls = 39kg
Weight (kg)
Mean
Modal
Median
Range
Boys
54.46667kg
40kg<=w>50kg
55kg
48kg
Girls
49.1kg
40kg<=w>50kg
49kg
39kg
The modal measure for both boys and girls are the same. However for the rest it is higher for the boys. The evidence suggests that boys generally weigh more than the girls. In fact 9 out of 30 boys weigh more than 60kg but only 3 out of 30 girls weigh over 60kg.
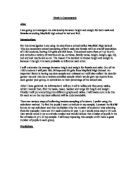
These conclusions are based on a sample of only 30 girls and 30 boys. I could extend the sample or repeat the whole exercise to get more definitive results.
Hypothesis
I think that in general the taller the person the heavier the person will be.
Line of best fit
There is a positive correlation between the weight and height of the boys. Using the line of best fit suggests that if someone was 1.8m they should weigh 55kg. However this is only from a sample of 30 boys so it may not be completely correct.
Line of best fit
There is a positive correlation between the weight and height of girls. Using the line of best fit suggests that if someone were 1.6m they would weigh 48kg. However this is only a random sample of 30 girls and may not be completely correct.
Height, h (m)
Cumulative Frequency
Boys
Girls
Mixed
.20<=h<1.30
2
0
2
.30<=h<1.40
2
0
2
.40<=h<1.50
4
4
8
.50<=h<1.60
7
6
23
.60<=h<1.70
4
25
39
.70<=h<1.80
24
30
54
.80<=h<1.90
27
30
57
.90<=h<2.00
28
30
58
2.00<=h
30
30
60
Below is a cumulative frequency table of the boys the girls and the mixed population, which are both of them mixed together.
sathesh singaraj Page 1 5/1/2007