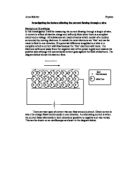
In a hot wire metal ions vibrate from fixed positions. The vibrations of the metal ions occupy a larger volume as they have a greater vibrational energy due to the high temperature. This will cause there to be more collisions between the free electrons and the metal ions and therefore there will be a high resistance. The current will therefore be low as the free electrons will move through the metal slowly. This is shown in the diagram below.
If the circuit is left connected up too long the wires will heat up causing the resistance to increase and the current to decrease. This will make the results less accurate.
The material that the wire is made from will also affect the current that flows through the wire. Materials can be divided into 2 main categories, insulators and conductors.
Insulators do not have free electrons and therefore do not conduct electricity easily. They have a high resistance and resistivity. Conductors are substances that have free electrons and therefore will conduct electricity. They have a low resistance and a low resistivity. Insulators have a higher resistance than conductors because it is harder for the current to flow.
Different metals have different resistivities and you can use the resistivity to tell you how good a conductor a substance is. The equation for resistivity is shown below,
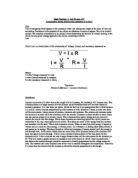
Resistivity (ρ) = resistance (R) x Cross sectional area (m2)
Length (m)
The voltage supplied from the power source also has an affect on the current. The greater the voltage the greater the current.
Preliminary Work
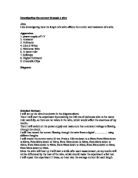
There were three wires to choose from of thickness 0.27mm, 0.38mm and 0.71mm. I have only carried out tests using the 0.27mm and the 0.38mm wires because if I were to use the 0.71mm wire because the current would be high. This would cause the wire to heat up too much and would be dangerous. I measured the thickness of the wires using a micrometer. This is a device used to measure very small diameters and is very accurate (to 2 decimal places).
Method
- Set up the apparatus as shown in the diagram above.
- Set the power pack to 2.02V.
- Measure the current through the 0.27mm wire at the lengths, 20cm, 40cm, 60cm, 80cm and 100cm.
- Record the results in a table.
- Repeat for the 0.38mm wire.
Results
I do not think that this range of lengths is suitable as only 5 readings for each wire are obtained. I will repeat the experiment again but record the current every 5cm. This will help to make my results more accurate.
Method
- Set up the apparatus as shown in the diagram opposite.
- Set the power pack to 2.02V.
- Measure the current through the 0.27mm wire at the lengths, 5cm, 10cm, 15cm, 20cm, 25cm, 30cm, 35cm, 40cm, 45cm, 50cm, 55cm, 60cm, 65cm, 70cm, 75cm, 80cm 85cm, 90cm, 95cm, and 100cm.
- Record the results in a table.
- Repeat steps 1-4 for the 0.38mm wire.
- Repeat steps 1-5 to make results more reliable.
- Calculate average current.
Results
I have drawn a graph of the results as shown on the following pages, to aid me when choosing the most suitable wire. The results show that the values for the 0.38mm wire fluctuated more than those of the 0.27mm wire. I have therefore decided to use the 0.27mm wire as they did not fluctuate at all. This will give me more accurate results when carrying out the experiment. Also the graph of the 0.27mm wire is better as most points fit on the line whereas for the 0.38mm graph there are more points that do not fit. I have found that the range I have used is suitable. Measuring at 5cm intervals will give me more values and will make the graph more accurate and easier to plot. Also they will show a stronger relationship between current and length.
When carrying out preliminary work I have decided to use a power pack with a negligible internal resistance as this will make my results more accurate. The power pack that I have chosen to use has an adjustable voltage allowing me to set it to the voltage I want. I have decided to use a voltage of 2.02V as it gives a reliable and safe set of results. Anything smaller would give too low readings and anything higher would give to high readings. I had planned to use 2V however it was difficult to set the dial to exactly 2V and the nearest I could get was 2.02V.
Fair Test
The experiment will be fair because I will only change the length of wire.
I will:
- Use the same voltage of 2.02V
- Use the same wire of thickness 0.27mm
- Connect the crocodile clips the same way each time
- Keep the material of wire the same (Nichrome)
- Keep the multimeter on the same range
Prediction
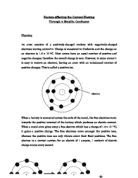
I think that as you increase the length of the wire the current will decrease. I think that the length of wire is inversely proportional to the current. This means that when the length doubles the current halves. This is because the longer the length of wire the more difficult it is for the current to flow. This is because the longer the length of wire has more material for the electrons to flow through meaning there are more ions to collide with. The more collisions there are the higher the resistance of the wire because the electrons loose more energy so slow down. Therefore the current decreases. This is shown in the diagram below.
Safety
Make sure that the circuit is set up correctly and that there is not a short circuit. Also do not use a high voltage, which could cause overheating. To prevent the wires overheating the circuit should only be connected up for a short amount of time. As well as this equipment must be checked to make sure it is working correctly. When working with the electrical equipment it is important to have dry hands.
Equipment
- Power pack
- Connecting wires
- Crocodile clips
- Metre ruler
- Wire of diameter 0.27mm
- Multimeter to measure resistance (Ω) and current (A)
Method
1. Set up the apparatus as shown in the diagram above.
- Set the power pack to 2.02V.
- Measure the current through the 0.27mm wire at the lengths, 5cm, 10cm, 15cm, 20cm, 25cm, 30cm, 35cm, 40cm, 45cm, 50cm, 55cm, 60cm, 65cm, 70cm, 75cm, 80cm 85cm, 90cm, 95cm, and 100cm.
- Record the results in a table.
- Repeat steps 1-4 twice to make results more reliable.
- Calculate the average current at each length.
Results
Diameter = 0.27mm
Voltage = 2.02V
Method
1. Set up the apparatus as shown in the diagram above.
- Measure the resistance of the 0.27mm wire at the lengths, 5cm, 10cm, 15cm, 20cm, 25cm, 30cm, 35cm, 40cm, 45cm, 50cm, 55cm, 60cm, 65cm, 70cm, 75cm, 80cm 85cm, 90cm, 95cm, and 100cm.
- Record the results in a table.
- Repeat steps 1-3 twice to make results more reliable.
- Calculate average resistance at each length.
Results
Diameter = 0.27mm
Conclusion
The results tables show that there was an average current of 1.55A at 5cm.
There was an average current of 0.40A at 25cm.
There was an average current of 0.21A at 50cm.
There was an average current of 0.14A at 75cm.
There was an average current of 0.10A at 100cm.
The results also show that there was an average resistance of 1.47Ω at 5cm.
There was an average resistance of 5.17Ω at 25cm.
There was an average resistance of 9.83Ω at 50cm.
There was an average resistance of 14.47Ω at 75cm.
There was an average resistance of 19.30Ω at 100cm.
I have drawn graphs of the results showing the change in average current and resistance against the change in length. The graph showing resistance and length is a straight line graph which does pass through the origin. This shows that as the length of the wire increases the resistance decreases. The length is directly proportional to the resistance. Therefore when the length doubled the resistance also doubled. The results below support this with a small experimental error.
20cm = 4.27Ω 40cm = 7.93Ω
30cm = 6.07Ω 60cm = 11.63Ω
25cm = 5.17Ω 50cm = 9.83Ω
40cm = 7.93Ω 80cm = 15.37Ω
50cm = 9.83Ω 100cm = 19.30Ω
The graph showing average resistance against average current shows that as the resistance increases the current decreases, they are inversely proportional. The graph is a curve and does not pass though the origin.
The graph showing average current and length is a curve and shows that as the length of wire increases the current decreases showing that they are inversely proportional. The curve does not pass through the origin. The shape of the curve shows that as the length of wire is increased the current goes down in smaller and smaller steps. So the rate of change of the length with respect to current is getting less. This is shown on the graph as the slope of the curve is getting less. I have taken five points from this graph as shown in the table below.
This table shows that I x L is a constant when allowing for experimental error. I think that the slight change in value is due to the fact that the temperature of the wire was not constant throughout the experiment. The following equation can be used:
I x L = k where k is a constant
Therefore I = k
L
This shows that there is a pattern in the results as the current is inversely proportional to the length.
I α 1
L
This shows that as the length increases the current decreases. The results support this because:
20cm = 0.50A 40cm = 0.26A
30cm = 0.34A 60cm = 0.17A
25cm = 0.40A 50cm = 0.21A
40cm = 0.26A 80cm = 0.13A
50cm = 0.21A 100cm = 0.10A
Allowing for experimental errors the results show that the length is inversely proportional to the current. This means that as the length doubles the current halves.
The current is inversely proportional to the length because as you increase the length of the wire you increase the resistance. The longer the length of wire the more material there is for the electrons to flow through meaning there are more ions to collide with so a greater chance of collisions. The more collisions there are the higher the resistance of the wire because on collision the electrons lose energy so slow down. The current will therefore decrease as the charges will move slower through the circuit. This causes the current to decrease as the length of the wire increases. A diagram of this is shown below.
I have used the resistance of the wire, the length and the cross sectional area in order to find the resistivity. This measures how good a conductor a material is. As the same material was used the resistivity of the wire at different lengths should be the same with a small allowance for experimental error. Even though the length will change the resistance will also change and as these two numbers are directly proportional the resistivity should be constant. I used the following formula to work out the resistivity
Resistivity (ρ) = resistance (R) x Cross sectional Area (mm2) A
Length (mm) L
= R x A
L
The equation below shows the units of resistivity.
Resistivity (ρ) = Ω x mm2
mm
= Ωmm
Therefore the values I work out will be in Ωmm.
I can use the thickness of the wire to work out the cross sectional area y using the following formula.
Area = πr2
= π ( d )2
2
= π
= πd2
4
= π 0.272
4
= 0.057255526mm2
ρ = R x A
L
= 1.47 x 0.057255526
50
= 0.001683312468
ρ = 0.0017 (to 4d.p)
The table below shows the resistivity at lengths 50mm to 1000mm
This table shows that the results were very similar there is only a difference of 0.0006Ωmm between the resistivity of 50mm and 1000mm. This may be due to the change in temperature of the wire as this would affect the resistivity. I have taken the resistivity of nichrome to be 0.0011Ωmm as this was the number that occurred most often. Also when carrying out the experiment the current and resistance was first recorded at a length of 1000mm. This means that the wire would have not heated up much at this length which would make the results at this length more accurate. However when allowing for a small experimental margin you can see that the resistivity is constant. This is because the same material has been used. This value of 0.0011 Ωmm tells me that nichrome is a good conductor. I have used the internet to find out the resistivity of other materials.
Copper = 0.0000000168 Ωm
Quartz = 750000000000000000 Ωm
I have converted the value I calculated into Ωm to allow for comparison.
ρ = 0.0011
10000
= 0.0000011Ωm
This shows that copper has a much lower resistivity than nichrome, which tells me that copper is a better conductor. Quartz has a very high resistivity, which shows that it is a very poor conductor. Nichrome is often used for heating coils, this is because it will not heat up so much as to melt but it will allow the electrons to move and will give out some heat. When researching on the internet I found that the resistivity of nichrome is 0.0000010Ωm. This shows that my results were quite accurate as the difference was only 0.0000001Ωm which is very small.
My conclusion does agree with my prediction because I predicted that as you increase the length of the wire the current will decrease and that the length of wire is inversely proportional to the current. This is what I have found out as stated in my conclusion showing my prediction was correct.
Evaluation
When carrying out the experiment I made sure that the test was fair by using the same voltage of 2.02V, using the same wire of thickness 0.27mm, connecting the crocodile clips the same way each time and by keeping the material of wire the same (nichrome). This helped to make my results more accurate. The results show that as length increases current decreases.
The graph of the data shows that the results were very accurate. This is because all the points are on the line of best fit. This shows that there was not much variation in results when repeating the experiment. This shows that there were no anomalous results. This is shown in the table below as all 3 readings are the same or very similar.
The only variation of results was recorded at 5 and 15cm and even this was only a difference of 0.02A. I think that this slight difference may be due to the temperature of the wire. As the current at 5cm was the last to be recorded with the current at 15cm being only shortly before it is possible that the wire may have been heated up slightly despite the fact that when taking each reading the wire was only connected up for a short amount of time. This would have caused a small inaccuracy because if the clips were on too long this would have caused the wire to heat up. This would cause the resistance to increase and therefore the current would decrease. Despite this I think that the method used for the experiment was suitable. I was able to use sophisticated equipment, which would have allowed me to gain accurate results. For example I was able to use a power supply with negligible internal resistance and I able to use a micrometer. This allowed me to measure the diameter of the wire accurately as it measures to an accuracy of 0.001mm. I was also able to use an ammeter, which allowed me to measure the current to 0.01A.
The main problem with the experiment was with the wire itself. This was because the wire was attached to a piece of wood with nails at the end. This made it quite difficult to establish where the zero mark was. Also the wire was not taut on the wood which made it hard to measure the length accurately. The wood was measured and then the crocodile clips were then connected to the wire at this point. However this method would have cause small inaccuracies. This may account for the slight variation in current on some of the repeat readings, because the clip may not have been connected at exactly the same point each time. This could be improved by having a taut piece of wire attached to a metre ruler as this would help to reduce errors when measuring the length. Another problem was the crocodile clips as these were quite large. This meant that when connecting the clips to the wire they would not be at exactly the right mark. This could be solved by either using much smaller crocodile clips or by attaching a small piece of wire to the end of the clip to insure that the connection is made at exactly the right point. Using a piece of wire on the end of the clip would also help in preventing the wire from heating up. This is because it would be much quicker using the wire as you would simply have to touch the wire for a split second to obtain a reading. When using the crocodile clips it took longer than this because you had to clip on to the wire an then off again. This may have caused the temperature of the wire to fluctuate slightly. If these modifications were made to the experiment then it would help to make the results much more accurate.
When carrying out the experiment I think that I took a sufficient number of readings in order to gain reliable results to support my conclusion. I took 20 readings and then carried out 2 repeats which means that a total of 60 readings were taken. This makes the results reliable. This is shown on the graph as all the points are on the line of best fit showing a very strong relationship between length and current. However more repeats could be carried out in order to further increase the reliability of the experiment.