It is important that the tray is always lifted to 2cm, because this will make sure that the investigation is fair. It will also make sure that there is only one variable in the experiment, which is the depth of water.
When the tray is lowered, it will be done by hand at an even uniform speed. Obviously, the speed in which this is achieved; every time the tray is lowered will not always be identical, but a general similarity in speed will be attained.
Consequently, this should not cause a major problem in this investigation.
When the tray is lowered, this generates a wave, which travels along the tray, reflects at the end and returns.
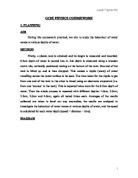
In order to measure the wave’s speed, I will draw a mark (using a marker pen), in the longer inner side of the tray, 12 cm from the edge and another mark, 15 cm apart from the first mark. (This leaves 10cm of the length of the tray remaining). Using the stop clock, I will time how long it takes for the first wave to pass the two marks and record it. The markers are 15 cm apart, as this gives me ample time to start and stop the clock watch, whilst observing the travelling wave. There is human error, when starting and stopping the stop clock and I estimate that this error is about 0.1 seconds as it is roughly the reaction time of a young person. If the distance is too small, due to my reaction time, I may not have enough time to operate the stop clock appropriately. This would be especially hard when the speed of the waves increase, because they would travel the distance much faster, making it even tougher for me to time it. In order to calculate the speed of the waves, the formula, v = d/t is used. (Where, v = speed of waves, d = distance travelled by waves and t= time taken).
The distance would be 0.15 metres (distance between marks).
After the time is recorded, the procedure should be repeated again twice, giving 3 ‘time’ readings. Obtaining three readings provides additional data to calculate an average and will thus increase the accuracy of the speed calculations.
This whole method should be repeated again, but using a depth of 1.0 cm, then 1.5cm, and so forth, every 0.5cm up to 4cm.
The whole experiment will then be repeated again. This is to confirm and justify the previous results, revealing if any of the previous readings were inaccurate or reliable.
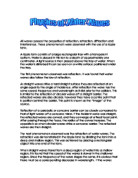
A graph showing speed against the depth can be plotted. I predicted that the speed will increase as the depth increases, hence, I predict that the graph would look as such: -
This yields a curve that turns over as depth increases. This is because the rate at which the wave increases it's speed is high, then, as the depth increases, the rate decreases.
In order to show the relationship between the wave velocity and the depth of the water, (using the formula v2=g*d) I will plot a graph of v2 against d. This should show that v2 is proportional to depth: -
The shape of the graph supports the formula. The gradient of the graph is the ‘g’ in the formula (acceleration of gravity – 9.8 N/kg). If I find out the gradient, this should be near or equal to 9.8. If the value is close to the true value, this will act as a test and confirmation for accuracy in the experiment.
Fair Test
In order to keep this experiment fair, certain aspects of experimentation must be kept constant. This is to ensure that there is only one in the experiment.
The height at which the tray is lifted must be kept constant and the relative speed at which it is lowered must also be kept relatively constant.
The same liquid must be used, this being water. Different liquids have different properties, and this may affect the speed and manner in which the waves travel.
The distance, from which the travelling waves pass, must be kept constant. If this changes, then the speed calculations would be completely wrong, since the formula for speed is ‘distance/time’.
The depth of water must be accurately measured, as this is the variable in the experiment, and so therefore extra accuracy must be implemented.
Safety
In order to ensure the safety of this investigation, certain basic aspects of experimentation must be taken into consideration. These are to:
Wear safety spectacles
Wear a laboratory coat – this would prevent any water spillage getting on clothes.
Tie hair back – this ensures that hair does not get in the way of vision, which could impede carrying out the experiment.
Make sure that all bags and objects which could cause any accidents, are away from area of testing.
A few modifications had to be made in order to gain dependable results.
Firstly, after a depth of 0.1 cm, I was unable to start and stop the stop clock when the wave passed the markings. Consequently, I increased the distance of the markings from 15 cm to 27 cm. This enabled me to time the travelling wave properly.
The spine of my physics textbook is exactly 20mm wide. I used this to measure the height at which the tray was lifted, instead of using the initial ‘ruler’ method.
The bottom of the tray was flat when I measured the depth of the water at various positions in the tray.
Results
First experiment
Second experiment
From these results, I have observed that the speed for 0.04 metres is an anomaly. This is because, compared to the rest of the results obtained, this reading is too high in comparison. The difference between the reading and that of 0.035 metres is 0.73 m/s. This is very high, considering that the differences between the other speed-readings are between 0.03 and 0.14 m/s.
Hence, when plotting the graph, I will omit this last reading, as it will affect the trend of results.
Analysis
From the results, it can be seen that as the depth of water increased, the speed of the wave increased. This supports my initial prediction. This can be seen where, at 0.005m, the speed was 0.34m/s, then at 0.03m, the speed was 0.71 m/s.
This is better illustrated on the graph (plotting speed against depth) that was obtained. The graph was a curve, showing that the speed of the wave increased as the depth increased. At first, the curve is shallow, then at 0.015m, it begins to get steep. This shows that at low depths, the rate at which the speed increases is slow, and it becomes faster as the depth increases.
The rate at which a wave loses its kinetic energy is inversely related to its wavelength. When the wave is moving at a high speed, it has a long wavelength. Since it has a large wavelength, it will lose little kinetic energy as it propagates. Hence in very deep water, the wave will travel at high speeds and travel the distance with limited kinetic energy loss.
Error: In all calculations involving an average the standard error of the mean should be used as the uncertainty, not the standard error.
Most of the error in this experiment is random and comes from starting and stopping the stopwatch precisely as the wave passed the marks. I tested my reaction time, by quickly starting and stopping the stop clock. I got an average of 0.12 seconds. This is the same error (to 2 significant figures), which I estimated in the plan. Thus, the error is given by: -
(0.1 sec)/(T~1.0 sec), which gives 10%.
Theoretically, in the v2 vs. depth graph, all the points should lie on the line of best fit, but due to error, none of them lay on the line. Error bars can be drawn, to represent the possible values that the speed and depth could be. In order to work out the error of the depth and speed, the distance between a plot and the line (horizontally) could be measured. This would give the error of the depth for that particular plot. This is repeated for all the points, and an average error of depth can then be calculated. This average error can then be used to plot error bars for all the points (for depth). This same method is used to find the error of speed, i.e. measure distance from plot to line vertically.
Error of depth
- error = 0.003m
- error = 0.0015m
- error = 0.0025m
- error = 0.004m
- error = 0.0035m
- error = 0.0035m
- error = 0.001m
Average error = 0.003 + 0.0015 + 0.0025 + 0.004 + 0.0035 + 0.0035 + 0.001 / 7
= 0.0027m,
0.003m (in 3 sig fig)
Error of speed
- error = 0.045m/s
- error = 0.02m/s
- error = 0.035m/s
- error = 0.06m/s
- error = 0.05m/s
- error = 0.05m/s
- error = 0.01m/s
Average error = 0.045 + 0.02 + 0.035 + 0.06 + 0.05 + 0.05 + 0.01 / 7
= 0.039m/s
0.04 m/s (in 3sig figs)
When the error bars are drawn, it can be seen that all the error boxes lie on top of the hypothetical line. This is a good indication, as it shows that the results are to a degree of accuracy and that the formula, v2 = g*d is correct.
The v2 against depth graph that was obtained shows that the speed squared is directly proportional to the depth of the water, i.e. as the depth of water increases, the speed of the travelling wave increases in proportion to the depth. This supports my prediction and predicted graph.
At a shallow depth, the waves are slower because of the friction from the tray. Friction at the bottom of the tray, slows down the waves, therefore the wavelength becomes shorter. The wavelength decrease results in ‘ wave crowding’. The circular motion of the water particles become more elliptical and the shorter wavelength translates energy into greater amplitude. So, at around 20 degrees, the waves become too steep and they "break." (In the experiment, the amplitude of the wave was not high in comparison to the wavelength, so ‘breaking’ of the waves did not occur).
Wave base is the depth to which wave energy penetrates below the surface. Wave base is related to the size of waves; "wave base equals about one half of the wave length." The action of friction against the wave bottom dissipates wave energy.
The graph obtained was a straight-line graph. The formula for a straight-line graph is
y = mx + c. If this formula is compared to the formula, v2 = g*d, we can see that the
speed squared equals ‘y’, gravity equals ‘mx’, (the gradient) and the depth equals ‘c’,
(the y-intercept).
The value of the acceleration of gravity is 9.8 N/kg. It can be seen from the formula that the gravitational acceleration is the gradient. Therefore, theoretically, the value of the gradient should be 9.8 N/kg.
Gradient of line - change of y / change in x = 0.6 / 0.04
= 15 N/kg
The gradient of the graph is 5.2 N/kg higher than the proper value.
The error for the ‘g’ calculation is, (5.2 / 9.8) * 100 = 53%.
This is quite a large error, reasons for which will be discussed in the evaluation.
Using the error bars, one is able to find the maximum and minimum gradient that could be obtained. This can be achieved by drawing a dotted line that goes through the lowest part of the error boxes and a dotted line going through the highest parts of the error boxes, thus showing the limits in which the results lay. From the graph, it is possible to see that the gradients would be very different from each other, showing that the uncertainty is high.
The gradient of the top line is 16.9
The gradient of the lowest line is 12.8
The difference between them is 4.1
The difference between the gradients is relatively high, showing that the results are
not too reliable.
Evaluation
In the speed squared vs. depth graph, there were many anomalies, as virtually all the points lay close to the line, but not directly on it. This is also the same for the speed vs. depth graph. Theoretically, they should all lie on the line, but scientific experimentation is liable to various sources of error and restrictions, which do not permit the results to be 100% accurate.
The amount of error in the experiment is also represented by the gradient that was obtained. The value of the gradient was 5.2 N/kg more than the actual value of gravity. The percentage error was 53%, showing that roughly half the results were erroneous.
A reason as to why these anomalies are present is because of the fact that I had to use my eyes to measure when the waves passed the markings. This is not entirely accurate because using sight is unreliable, as I may have blinked at the exact time the wave passed the markings, thus causing me to press the stop clock at the wrong time. Each fraction of a second is valuable, and if the stop clock is started too early, or stopped too late, this can cause a great difference in the readings, thus giving irregularities in the speed-readings.
Moreover, when lowering the tray to start the wave pulse, I did not always lower the tray at exactly 20mm, despite the fact that I used the spine of a book to assist. This was because my hand was resting on the book, before lowering the tray and sometimes I found it very awkward to lower the tray. This meant that the speed in which the tray was lowered varied and the height would have varied by a few millimetres. These are a few of the factors which I mentioned should be kept constant, in order to keep the experiment to one variable. Since these factors were not kept completely constant, it would have had a slight effect on the results obtained and added to the error.
At first, when lowering the tray, I waited for the wave to travel to the end of the tray and on it’s first reflection, I timed it when it passed the marking. But, as the waves became faster, I found it exceedingly difficult to time the wave after the first reflection. Therefore, I waited until the 3rd or 4th reflection, (so as to get the general course and sequence of the travelling wave) before timing. To ensure that the number of reflections that the waves undertake do not affect the speed, I could do a further investigation, to find out if speed varies with the number of reflections. I could time the wave after one reflection, then 2, then 3 and so on, up to 10 reflections.
The waves travelled very fast at depths of 3.5cm and 4.0cm, which made it quite difficult for me to time. In order to solve this problem, this experiment could be repeated, but the distance from which the waves are timed could be increased, to about 50cm. (This would mean that the container would have to be much bigger, since the length of the tray would be too short). This would enable me to visually see the travelling waves much better, and so it would be easier for me to time the wave. This would greatly increase the accuracy of the time results.
As well as this, I could also increase the depth of the water investigated up to 20 cm. This would give me a bigger range of results, making the results more reliable.
A mechanism can be used to lift and lower the tray. This would ensure that the tray is always lifted at exactly the same height and speed all the time. This would therefore make the experiment more precise.
In order to extend this investigation further, I would investigate whether the height at which the tray is lifted, affects the speed of the wave pulse created. This would help me to know how important and effective it was for me to lift the tray to the same height at all times and subsequently to know the amount of error that lay with this factor.