Prediction: If the surface of the runway is smooth then the trolley will travel faster. If the surface of the runway is rough then the trolley will travel slower due to friction between them.
The trolley will travel slower if the surface of the runway is rough. This is because friction is higher in rough surfaces than it is in smooth surfaces. Frictional force is working against the flow of motion. So the trolley goes down the runway but friction is trying to slow it down so the force becomes negative. One of Newton’s law (the law of motion) is F=MA. Where F=Force, M=Mass and A=Acceleration. The trolley accelerates due to gravity but not as fast as it could have due to friction- depends on how rough the surface is.
The trolley will also be slower if the surface has many bumps. If the trolley is going through bumps it will find difficult to reach the bottom. The bumps may even cause the trolley to stop – depending on how big the bumps are.
What is Friction?
Friction is the result of collisions of the object's leading surface with air molecules. The actual amount of friction encountered by the object is dependent on a variety of factors. The two most common factors, which have a direct effect upon the amount of, friction, these are the speed of the object and the cross- sectional area of the object. Seeing as we are using the same trolley we can focus on the speed. Increases in speed, results in an increased amount of friction. If the speed of the trolley traveling down the ramp is high we then know that that the friction is also high.
Variable 3: Shape of the Trolley (aero dynamics)
Prediction: An aero-dynamical (streamlined) shaped trolley is going to be faster than a non aero-dynamical (non-streamlined shape) trolley.
The forces working against the flow of motion is Friction and Air Resistance.
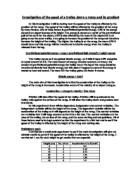
Aero dynamical (streamlined) shape
The arrows in the above diagram represent the forces acting against the flow of motion – against the direction the trolley is moving. As you can see there are arrows which jump off after hitting the trolley. This represents the partial force that is deflected because of the pointy surface.
Non aero-dynamical (non-streamlined) shape
You can see that the too diagrams differ. Friction and Air Resistance have a bigger impact on the non aero-dynamical shaped trolley – that is why planes do not have a flat top but a pointy one. Before we said that the more frictional force there is the slower the trolley will travel so this means that an aero-dynamical shaped trolley will travel faster than a non aero-dynamical shaped trolley.
Variable 4: Force Exerted
Prediction: More starting force will result in a higher velocity.
Before we saw that the trolley it self has potential energy, but when something extra is added for e.g. a spring, then it’ll help the trolley go faster. This is because the initial force is being increased, so there is a larger initial force, in so making the trolley go faster. You can make the trolley go even faster, to do this you’ll have to compress the spring to its maximum. So again you will be increasing the force, resulting with a larger initial speed and a faster trolley.
Equipment:
Trolley
Runway
Timer
Calculator
Measuring Stick/Tape
Plan
In this experiment we plan to find out what affects the speed of a trolley on a runway. The experiment will be carefully carried out, and the steepness will be changed. One end of the ramp will be in contact with the surface while the other end will be heightened. This is so we can make the ramp steeper. The heights used will be: 30cm; 35cm; 40cm; 45cm; and 50cm. The structure of the experiment is shown below:
The length of the ramp will be 2.38m and will not be changed. For safety I’ll ensure that everybody is at a distance from the experiment so there’ll be no accidental injuries.
In order to keep a fair test I’ll make sure that:
The same ramp is used for each test.
The same trolley is used for each test.
The height of the ramp double-checked.
Each test will be repeated three times and the average will be used.
Method
We’ll be using a piece of wood which is 2.38m long. There will be a non-aero dynamical trolley used for the experiment. A few objects will be used to vary the height of the runway. At first we’ll put the piece of wood in angle, so the trolley can go. One end will be in contact with table’s surface, while the other end lifted up to a certain height. One person in the group will place the trolley and hold it at the top of the runway. Then they’ll let it go when told to so the stopwatch will be started at the correct time. When the trolley reaches the bottom (exits the ramp), the stopwatch will be stopped and the time recorded. Each test will be done separately. Then I’ll put all the results in a table and work out the speed the trolley was traveling at. Also finally I’ll calculate the average of he speeds.
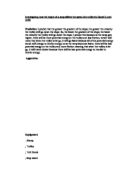
Results
Conclusion
My results show that as you increase the height of the ramp you also increase the speed therefore decreasing the time taken for the trolley to travel down the ramp. Looking at my graphs I can see that they all support my hypothesis and all backup my predictions. The graph concerning speed is very accurate as 4 of the 6 points fall under the ‘line of best fit’, but for the ‘distance’ graph the line of best fit is not as useful. This is because it cannot show that the trolley is reaching a terminal speed and so the line of best fit there would not be accurate to use. My results gives a clear indication that at an increase in gradient, means that the trolley will be accelerating more and reaching the ground more quickly. The speed of the trolley is very interesting, as I predicted the higher the height the faster the speed but towards the end of my graph the speed starts to reach a terminal speed, a constant value. Anything held above the ground has gravitational potential energy. The trolley traveled fastest when the ramp was the steepest (50cm), and the trolley traveled slowest when the ramp was at its lowest (30cm). All the gravitational potential energy in the trolley will be converted into kinetic energy. The trolley will have more gravitational energy converted into kinetic energy at 50cm than it will have at 30cm, so the trolley travels fastest.
Evaluation
This experiment has been enjoyable. This experiment has vastly improved my research skills with using books from the library and using the Internet more efficiently. School experiments are not 100% fair due to the lack of advanced technology. Although it is not 100% fair we have still concluded results which professional scientists would have concluded as the main ideas have been proven. So the experiment is right to a degree of accuracy and is enough to obtain the main ideas.
Although the main idea has been proven anomalous results can still be obtained. To be precise the 1st attempt of the 35cm testing is inaccurate. This is because it is equal to the 1st attempt of height 30cm’s. This is the only anomalous result I have obtained so it cannot pose a huge impact and affect the main idea.
In this investigation we decided to change the gradient of the ramp by varying the height of the ramp. If I were to repeat the investigation I would make sure that the following are included:
1. Extend the ramp to expand my results and get more results which I can conclude on.
2. Also to expand the experiment include more variables and also do a preliminary test to see which is the best trolley to use for the actual experiment.
3. The ramp is cleaned with a cloth after each test so there is no dirt slowing the trolley as it travels down.
4. Also repeat the experiment more than three times for a better overall result. This would ensure reliability even more and again will help spot anomalous results.