The bigger the gradient the more spaced out the dots will be because the trolley is travelling at a faster rate. The smaller the gradient the less spaced out the dots will be, indicating that the speed of the trolley is travelling at a slower rate.
Newton law's of motion
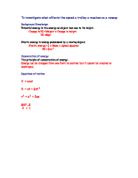
Every action has an equal but opposite reaction
From this law we can explain the above diagram. In the above diagram Newton's law is present. Force 1 shows the ramp pushing the trolley forwards, and force 2 shows the trolley pushing back on the ramp. The forces in the above diagram are equal and therefore the black arrow, which shows the trolley heading downwards, indicates the resultant force.
We can also relate the direction of the trolley to Newton's second law of motion.
The relationship between an object's mass m, its acceleration a, and the applied force f is f = ma. Acceleration and force are vectors; in this law the direction of the force vector is the same as the direction of the acceleration vector.
The trolley is pulled towards earth by the force of gravity. The direction of gravity is downwards, the direction that the trolley is going is also downwards.
Apparatus
1 Trolley - weight of trolley (0.8 kg) Access to a staircase
1 Ramp - length of ramp (1670mm) Cello tape
1 Digital stopwatch
1 Metre stick
1 Ticker - timer
1 Roll of ticker timer tape
Several clips
Pen and paper
Access to a mains socket
Method
First of all we collected all our equipment. Then we placed our ramp against the first step of the staircase. Next we prepared the ticker - timer. We did this by first cutting a suitable length of ticker - timer tape, next we plugged the wires into the ticker timer in their rightful places and threaded the ticker - timer tape through the ticker- timer. Next we placed the trolley at the top of the ramp. We then stuck the ticker - timer tape to the back of the trolley with cellotape.
Next, one of us switched on the mains, which activated the ticker - timer and one of us let go of the trolley. We then timed (with a digital stopwatch) how long it took for the ticker timer to reach the ground. We then switched off the ticker - timer. Next we wrote the result onto a piece of paper using a pen. To find the height of the stair, we measured the stair with a metre stick. We took the ticker - timer tape of, from the back of the trolley and labelled it according to the height. After our first trial for that particular height we then did another two more trails. Next we set up the ticker- timer again, making sure the wires were plugged into the ticker timer in their right places, we threaded the ticker - timer tape through the ticker timer and stuck it down with cellotape onto the back of the trolley. We then measured the time the trolley took the to travel down the ramp and jotted the time down. We repeated this process for another time so we had three trials for that particular height. We then moved on to another height. First we placed a ramp on another stair and measured its height then we measured the time taken for the trolley to go down the stairs and put that into our table. Next we did three trials for this height. In total we did five heights, remember to change the height of the ramp, and measure it with a metre stick, each time recording the height into your results table. from coursewrok work info
As you can see, in this investigation I have incorporated ticker- timers. A ticker timer is designed to print dots onto tape at a steady rate of 50 dots per second. The use of a ticker-
timer can record the motion of a trolley down a runway. As the trolley accelerates down the runway, it pulls the tape through the timer at a faster and faster rate. Therefore the dots become widely spaced because the tape travels faster and faster. The time interval between successive dots is 0.02s (= 1/50s.) The tape can be marked into 10 dot sections, each section taking 0.2s (= 10/50s) to pass through the ticker- timer. The sections get longer as the tape goes through faster and faster. Note: In our experiment we could not calculate the acceleration of the trolley because if we took the initial speed of the trolley when it was at the top of the ramp which was 0m/s, this would mean the speed was constant and would not be accelerating. The only way you can actually calculate the acceleration of the trolley is by using a ticker timer. After setting up the ticker timer, we then released the trolley, which then travelled down the ramp. After recording our results we analysed the ticker timer tape. The following steps show you how to calculate the acceleration of the trolley using the ticker- timer tape.
1.) First cut the strip into 10- dot sections. Remembering that each section would take 0.2 s (= 10/50 s.)
2.) Them measure your first 10 - dot section with a ruler and write down measurement. Call this V1.
3.) Next, measure your second 10 - dot section with a ruler and write down the measurement. Call this V2.
4.) Next subtract V2 from V1 and write the result down. Then divide this result by 0.2 s; time taken for each second.
5.)
Now you have your acceleration of the trolley. Note: If you measuring the length of the ticker - timer tape in cm always covert into metres.
Continue this method for the rest of the heights.
Fair Testing: Fair testing is a crucial factor, which is a vital part of an investigation.
Without fair testing the experiment would be useless because the information gathered from the experiment would not be accurate/reliable. Here are some factors that I have drawn up to make my investigation as fair and as accurate as possible.
1. When the trolley was at the top of the ramp, we did not apply force on the trolley e.g. pushing the trolley down the ramp instead we just let go of the trolley remembering not to apply any force on to it.
2. When putting the trolley at the top of the ramp we made sure that the back wheels of the trolley were touching the top of the ramp.
3. Make sure that you get a trolley which has all three wheels working because if one or more wheels do not work this could also affect the speed of the trolley.
4. As the trolley reached the ground, we only stopped timing when the back wheels of
the trolley hit the ground not when the nose first reached the ground.
Safety Precautions: Safety is crucial part of any investigation. All experiment possess some kind of danger, with the safety features I have drawn up the risk of danger will be minimised.
1. Make sure you do not stand/sit in front of the ramp because when the trolley is travelling down the ramp with speed and you are in front of it before it reaches a halt the trolley will give you unpleasant plain.
2. Do not put the ramp in the air, if the trolley goes off the ramp, it is in mid- air and will reach the ground with a considerable force. Doing this might lead to damages to the trolley, you or any other passer by.
3. Conduct the experiment in a sensible manner.
Results/Conclusion
My results show that as you increase the height of the ramp you also increase the speed therefore decreasing the time taken for the trolley to travel down the ramp. Looking at my graphs I can see that they all support my hypothesis and all backup my predictions. My prediction of kinetic energy; the kinetic energy of an object is directly proportional to its speed was correct.
16cm the speed was 0.84 m/s 32cm the speed was 1.42m/s
16cm the kinetic was 0.28 J 16cm the kinetic energy was 0.81 J
You can see that if you divide the kinetic energy at 32cm by the kinetic energy at 16cm the answer is 2.89 (2.D.P)
If you then divide the speed at 16cm by the speed at 32cm and then square the answer the answer is 2.86.
Although the answers were not exact because 0.8 J was rounded to 0.81 J they are very similar.
Also my prediction for potential energy; as the height is doubled the potential energy is also doubled was also correct.
Height of ramp 16cm 16cm the potential energy was 1.28 J
Height of ramp 32cm 32cm the potential energy was 2.56 J
If you divide 16cm by 32 cm the answer is 2.
If you divide the potential energy at 16cm by the potential energy at 32 cm the answer is also 2.
This trends/patterns follow right through the sequence not just for the examples I have given you.
My results gives a clear indication that at an increase in gradient, means that the trolley will be accelerating more and reaching the ground more quickly. The speed of the trolley is very interesting, as I predicted the higher the height the faster the speed but towards the end of my graph the speed starts to reach a terminal speed, a constant value. Looking at my bar graph, this is a clear indication on how quickly the speed decreases when the height increases. The potential energy graph, was the graph with most stability as the line of best fit nearly matched the normal line. In the acceleration and the kinetic energy graphs the line of best fit was very similar with the normal line whilst in the speed graph, there was no stability because of the terminal speed towards the end. My results were reliable and there were no anomalous results. If you had to be precise than maybe the 1st attempt of 16cm was a little bit inaccurate and also the 1st Attempt of 32cm was also a little bit inaccurate. In my table I have calculated acceleration, but this calculation is wrong, and the only way to find acceleration is to use the ticker timer (in method.) Acceleration calculations are wrong and this is noted on the result table. I only found out after I did my results table that acceleration cannot be calculated without a ticker - timer.
Evaluation
I have enjoyed doing this experiment, this experiment has vastly improved my research skills with using books from the library and using the Internet more efficiently. This experiment has made me think about all the factors of an investigation not just the prediction, method and results. With any school experiment, the experiment is not 100% fair. But the experiment is right to a degree of accuracy and this enough to grasp the main idea. Even though the experiment was not a 100% fair it is fair enough, in the end we concluded the same thing as the professional scientists, who have the advanced technology to carry out experiments precisely. In this investigation we decided to change the gradient of the ramp by varying the height of the ramp. Instead of using wood blocks, which were at different heights, we used a flight of stairs. We measured the height of the step above the ground. This is why our height goes up in 16cm because that was the difference between each step. The height of the steps had to be measured with a metre stick so they were not precise but they were fairly accurate. If I had to do this experiment again I would change my method in order to make the experiment fairer. I would make sure that: -
1. After each experiment we cleaned the ramp with a cloth, to make sure that there was
no dirt which could affect the speed of the trolley as it travelled down the ramp.
2. Before we let go off the trolley, I held the ramp so that it would not tilt and therefore
it would not interfere with the speed of the trolley as it travelled down the ramp.
These above factors will also give me more accurate and reliable results. People consider accurate and reliable results as the same kind of result but it is not. Accurate results are results, which are right or correct results. A reliable result means, every time you carry out the experiment they are almost identical results. For example a normal weighing scale might give you reliable results, which gives you the same results each time you do the experiment but they are not as accurate as if you measure with a digital scale. I believe that my results are reliable but not accurate because we had limited resources to carry out the experiment with. Looking at my results they do follow a pattern and a trend. Both the potential and kinetic energy go up as the height increase but more potential than kinetic. The acceleration of the trolley is more than the speed of the trolley and both the kinetic energy and acceleration graphs are almost identical. I have no anomalous results but two inaccurate results, which do not fit in with the rest of the attempts at the same heights. This may have happened because the person timing the trolley may have pressed the digital stopwatch's stop button too late. Even though two of my results are a little inaccurate on the whole my results are reliable and I believe that you can draw a firm conclusion from them. My results do tell the basic idea that if the gradient of the ramp is increased so is the speed of the trolley and using Hi-Tec equipment will also give you the same conclusion. I believe the only other way of getting more accurate results is to use more accurate and precise equipment.
Physics Investigation: Motion of a Trolley
Plan:
Aim: To investigate the factors affecting the motion of a trolley.
Introduction:
Forces affect the motion of a trolley. There are two main forces which affect it and these are friction and gravity. Friction allows the wheels of the trolley to grip the surface of the ramp which it is travelling on. Also the trolley will slow down because of the resistance of the air as the shape of the trolley is not very aero dynamic. Friction is what allows the trolley to come to a stop. Gravity (the downward force) is responsible for making the trolley move as it pulls it down towards the centre of the earth. As there is no way the trolley can go through the slope it has to travel down it. The steeper the slope, the faster the trolley will go because there will be less time taken for the trolley to reach the bottom. This writing from coursework.inf
Key Variables:
∙ The surface of the ramp:
This is a key factor because if there is a smoother slope, there will be less friction and so the trolley will travel faster. This will be kept constant.
∙ The height of the ramp:
The greater the gradient, the faster the trolley will move down the ramp because it will be steeper. The lower the gradient, the slower the trolley will travel. This is because the forces of friction and gravity are unbalanced resulting in the trolley to move. This will be altered.
∙ Mass of the trolley:
The heavier the trolley is, the longer it will take to reach the bottom of the ramp. This is because, it will have a lower terminal velocity and so it will not accelerate to its full level due to the extra mass. This will be kept constant with no extra masses added to the trolley.
from coursewrok work info
∙ Weight of force pulling on the trolley:
As the weight of the force on the trolley increases, the trolley will move more quickly across a ramp without a gradient, this is because when a weight (which is attached to the trolley) is dropped, will fall more quickly down to the floor if the weight is heavier, which will pull the trolley across the ramp much quicker.
I have chosen to vary the height of the ramp as this is very simple and doesn’t require a complicated procedure. It will also be easy to obtain accurate results and analyse them. All other variable will be kept constant – ramp surface, mass of trolley, weight of force pulling on the trolley.
Safety:
The experiment is not very dangerous however there is still the risk of a small electric shock as I will be using electricity. Therefore I will ensure that hands will not be wet whilst touching electrical components. Also the trolley going down the ramp will need to be stopped otherwise it will fall on the floor and possibly cause injury or damage to the apparatus. To stop this from happening, I will face the ramp towards the wall so that the trolley hits the wall at the end of the ramp and it stops moving. I will keep all leads out of the way so that it is not possible to trip over them and they do not twist or tear.
Fair Test:
To keep this experiment a fair test, I will only change one factor (the height of the ramp) and everything else will stay the same, things like the distances in between the two light gates, the mass of the trolley, and the surface of the actual ramp. To make sure there are no errors and no unfairness, I will check that the apparatus has been set up correctly before taking each set of results and I will check that the other factors have not been changed.
Prediction:
I predict that as the ramp gets higher it will take less time for the trolley to reach the bottom as the gradient becomes steeper and so it will take longer for the trolley to reach terminal velocity. I predict that as the height of the ramp is doubled, the time taken for the trolley to reach the bottom will divide by two. Therefore I predict there to be a strong negative correlation as shown in the graph.
I will also be calculating the average speed of the trolley. I predict that with a greater height, there will be a higher average speed. The reason for this is that speed is distance over time. If the distance stays the same but the time decreases (the height of the ramp is increased), the average speed will increase.
Speed = Distance
Time
Therefore the less time the trolley takes, the higher the speed will be. If the time is doubled, the speed will be halved.
suhura, please do not redistribute this essay. We work very hard to create this website, and we trust our visitors to respect it for the good of other students. Please, do not circulate this essay elsewhere on the internet. Anybody found doing so will be permanently banned."
suhura, please do not redistribute this dissertation. We work very hard to create this website, and we trust our visitors to respect it for the good of other students. Please, do not circulate this dissertation elsewhere on the internet. Anybody found doing so will be permanently banned."
Preliminary Work:
I will be carrying out a preliminary experiment so as I can gain a greater understanding into what the main investigation will be like. To do this preliminary I will be using the following apparatus. This writing from coursework.inf
- Q.E.D.
- Two light gates
- Linking leads
- Trolley
- Ramp
- Lab jack
- Metre rule
- Clamp stands and bosses
Method:
1. Set up the experiment as shown in the diagram.
2. Take three sets of results for each height to obtain an average and so that anomalies can be spotted easily.
Diagram:
Results:
Conclusion:
The results of the preliminary support my prediction as the graph shows that there is a strong negative correlation saying that as the height increases, the time decreases.
The second graph also strongly supports my prediction that with a higher ramp, the speed will be higher because less time will be required for the trolley to reach the bottom. There is a general curve showing that as the height of the ramp increases, so does the speed of the trolley.
Improvements/Changes:
I believe that the experiment has worked successfully and that no changes or improvements need to be made.
Further work:
In the main experiment I will be working out the average speeds to see whether the height of the ramp is directly proportional to the speed of the trolley. In order to work this out I will be dividing the distance by the time. The distance is always 70cm and the time will vary with different heights as seen in the graph. It will be measured in (cm/s).
Speed = Distance
Time
Observations: This writing from coursework.inf
Analysis:
The evidence in the observations shows a trend where increasing the height of the ramp, decreases the time taken for the trolley to reach the bottom. It also shows that with an increase of height, there is an increase of average speed at which the trolley travels.
1.
Graph 1:
From the first graph, it is possible to conclude that as the height of the ramp increases, the time taken for the trolley to reach the bottom decreases. This strongly supports our predictions where the higher the ramp, the less time will be needed for the trolley. However it does not support the statement that doubling the height will half the time. This is because there is a steady decrease in time with a curve shown in the graph. This shows that the biggest decrease of time taken is at the beginning and the values become less spread apart making a curve. There is a trend because the line is showing a negative correlation. However there is no obvious pattern because the difference between each consecutive measurement decreases each time.
The Product Moment Correlation Coefficient between the height and time is -0.3. This is a weak negative correlation and means that with an increase in height, there is a weak direct decrease of time.
2.
Graph 2:
From the second graph, I can see that with an increase of height there is a clear increase of speed. However, from the graph, I can conclude that doubling the height does not double the speed taken for the trolley to reach the bottom. The curve on the graph is very similar to the prediction graph. This suggests that my prediction has been supported very strongly. With a steeper slope, there is a much smaller time needed to travel 70cm down the slope and therefore:
Less time = Higher average speed
Speed = Distance
Time
If we input values for the distance and time and then decrease the value for time there will be an increase in the value for speed:
Distance = 4cm
Time = 2s
Distance = 4cm
Time = 1s
From this example, it is possible to conclude that if the time is halved, the average speed will be doubled.
The Product Moment Correlation Coefficient between height and speed is 0.9. This is very strong positive correlation meaning that with an increase of height, there is a direct increase in speed at almost the same rate.
Evaluation:
I believe that the procedure used was accurate and successful as we have performed our aim correctly. However there were a few anomalies which have been accounted for.
Anomalies:
These following results are anomalous because if a trend line were to be drawn in the graphs, they would not be exactly on the trend line like the rest of the points. However they are not very far off so on the whole the experiment can’t be said to be inaccurate in this way.
I feel that overall the results were quite accurate. This is can be seen when looking at the graphs, which show a straight line with all of the points apart from one or a few being very close to or on that line.
The reasons for these few inaccurate results may have been as followed:
∙ The trolley may have been pushed slightly at the beginning therefore giving it an advantage.
∙ The apparatus might not have been set up correctly meaning that results could have been abnormal.
∙ The height of the trolley might not have been measured correctly and therefore, with a greater height, the trolley would have gone faster with a lower time.
As there were only three anomalies, I can say that the results obtained are reliable to the extent that a clear conclusion can be made from them. I believe that the results obtained do strongly support my conclusion and that further results do not need to be taken apart from the three anomalies which should be repeated.
Further work:
In addition to the experiment, further work does not need to be done. However to obtain more evidence to support my predictions and possibly to make another prediction, I would also vary another variable. The variable I would choose to vary would add a weight to the trolley pulling it down the ramp. This would speed it up and I would vary the amount of weights. To obtain good results I would drop the weight down onto the floor from a string attached to the trolley with the help of a pulley. With more weights, I would predict that the trolley would go faster down the slope and therefore there would be a lower time.
suhura. Thus, we can say that whilst this represents a progression, in the end we have come no closer to any "real" knowledge.
this coursework was downloaded from Coursework.info. Redistribution prohib