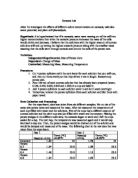
Controlled variable: amount of solute placed in dialysis tubing segments
Data Collection:
Data Table #1: Mixing Concentrations
Data Table #2: Percent Change in Mass
Data Table#3: Average Percent Change in Class
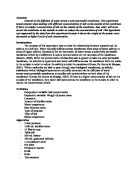
Data Processing/Presentation:
Graph#1: Class Average (% Change in Mass)
Graph 1 (above) shows the relationship between change in mass and concentration level.
Conclusion:
Osmosis is the passive movement of water molecules, across a semi permeable membrane, from a region of lower solute concentration to a region of higher solute concentration. It differs from simple diffusion in that it has limits. The mass in each dialysis tube segment decreased with the sucrose concentration level, revealing the corresponding relationship between the two. In other words, as sucrose concentration increases, the net movement of H20 molecules follows suit. Thus, there was a more distinct change in mass upon experimentation.
The process was observed in each tube segment, as there was a mass change in each of them, which shows that another substance must have been added to account for this change. Following the data recording of each segment’s mass, this number needed to be converted to a percentage so that a comparative change could be observed. Without completing this crucial step, this would not be easy to see, as there were different concentrations, and the change should be in relation to the sample number.
Some real-world applications of this process include kidney dialysis, which relies on osmosis in order to work, plants passing water from their roots to their leaves, which uses osmotic potential to draw water upward rather than flowing with gravity. Osmosis is an important process to everyday life.