The mean was calculated for each height and each ball.
mean=
rounded to 2 decimal place
To make the experiment more accurate and have more datas to compare, I designed the second phase of the experiment. The method used was the same, but the surface-on which the experiment was carried out- was changed from floor to table. Measurements were recorded as below:
rounded to 2 decimal place
Again, the mean was calculated using given equation.
mean=
rounded to 2 decimal place
Having all measurements done. I decided to put them in one table to discuss the observations more easily.
Considering the values of measurements from the table above, I can say that there is a significant differences between Pioneer ball and Dante. As the Pioneer took more time to bounce 6 times, I can deduce that the ball blew higher and therefore was lighter than the Dante ball, which needed less time to bounce and therefore I can say that it had bigger weight. Also, considering the difference between the measurements of the same ball but on different surfaces, I assumed that since the ball needs less time to bounce on the floor, it means the floor is more stiff and therefore more adequate and suitable for experiment. What is more, I couldn't deduce it without the other surface to compare the measurements.
Also, I calculated the uncertainities for each measurement using the equation
Uncertainity=
Using equation for calculation of one bounce (free fall)
s = vot + ½at2 where vo is initial velocity
t is time for bounces
a is equal to gravity value
And substituting the initial velocity as zero and acceleration as 9.8 ms-2 , we get:
s=½gt2, which leads us to a conclusion that there is the relationship between the time squared and the heght, even though the equation for free fall doesn't aply to the whole experiment.
Also, I calculated the uncertainities for each measurement of time square using the equation
Uncertainity=2∆t
I decided to create graphs showing the relationship between the time (square) and the height, to better understand the differences between balls.
Graph1: Time square taken for two ball to bounce 6 times on the floor
Graph2: Time square taken for two ball to bounce 6 times on a table
On both graphs there is a clear trend shown, as the graph of each motion is represented by the curve. The curve itself means that there is an acceleration present which causes the ball to change its velocity.
Not having enough datas to calculate the velocity - as it was not the point of my experiment- I did not calculate them, but I think that experiment was succesful and gave me enough datas to interpret to answer to my research question.
CE:
It has been shown on the graphs that there is a difference between the two balls. Let freely from the same height the Pioneer needs more time to bounce six times than the Dante, which also suggest that the Pioneer is heavier than Dante and is more attracted to the ground.
It is also shown that there is a big relationship between the height from which the balls were let freely and the square time and therefore the graph representing this dependence is linear.
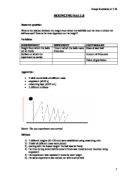
It has also been shown on a sketch, that each following bounce is shorter (in height) as the ball was wasting part of its energy, while converting mgh (Potential energy) into (Kinetic energy).
The fact that the graph doesn't go through the point (0,0) shows presence of the systematic error. As the exact value of air resistance and friction forces were not regarded, the error could occur.
Some mistakes and uncertainities are due to:
- different types of balls, as each ball have different properties
- different types of surface, as again, each have different properties
- time of human reaction [about 0.15 s]
- the uncertainty of measuring tape [±0.05 cm]
- the uncertainty of a stopwatch [±0.05 s]
-
the initial velocity of ball could have been other than intentional 0 ms-1
- the height from which the balls were let free could be imprecise
- air friction and friction forces could also affect the time of the measurement
- the uneven loss of energy of the balls during bounces also affected the experiment
- the bounces were uneven, depending mostly on the surface on which the experiment was taken
Some improvements could be made to make the experiment more reliable and to limit the influence of the uncertainities on the measurements:
- dropped the balls from higher level, so that the uncertainties of time are less significant and the measurements were easier to take
- made more measurements - this would lead to more accurate graphs
- use better stopwatch, reducing the uncertainty of time
- make sure the intitial velocity of balls are equal to zero, f.e. using starting block
- measure the time for one bounce and calculate from the equation of free fall
- use more balls of different type, to get more reliable results
- use more precise equipment like Vernier to have the measurements of velocity