Physics Investigation: F = ma using a Ticker Timer
Data Collection and Processing:
Mass of trolley – (496.70±0.01)g

Attached is the graph of a/ms-2 against F/N.
The first value, (1.25, 1.57) is rejected as the net force, 1.25N, is larger than the second value of 1.17N.
Gradient =
= 2.69 (3s.f.)
Maximum gradient =
= 2.90 (3s.f)
Minimum gradient =
= 2.48
uncertainty of gradient =
...
This is a preview of the whole essay
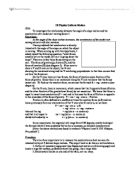
Attached is the graph of a/ms-2 against F/N.
The first value, (1.25, 1.57) is rejected as the net force, 1.25N, is larger than the second value of 1.17N.
Gradient =
= 2.69 (3s.f.)
Maximum gradient =
= 2.90 (3s.f)
Minimum gradient =
= 2.48
uncertainty of gradient =
= ±0.21
The gradient, which is a constant, shows that the acceleration is proportional to the net force applied.
Expected acceleration is calculated as shown below.
F = (M + m)a
Since F = mg, where g is the gravitational acceleration of 9.81ms-2.
∴ mg = (M + m)a
a =
Therefore, for the first row:
expected acceleration =
= 1.09ms-2 .
The % error is calculated by
Conclusion and evaluation:
With reference to the graph, since force and acceleration is proportional as stated by Newton's Second Law, the first value (1.25, 1.57) has been rejected as it has a larger force than the second value (1.17, 1.57). despite having the same acceleration and constant mass. The error maybe caused by reasons such as
- Mode of release: When the trolley was release there could have been a force applied that would have affected the readings of the ticker-tape. This would be a random error. It could have been eliminated by taking at least 3 reading and calculating the average. However, due to time constraints, only one reading was taken.
- Ticks not in a straight line: Since the tape is thin and flimsy, despite being set in a straight line, it, at times, bends as it passes through the timer. Thus, the dots were not straight and s that was measure using a metre rule would not be accurate. This would also be a random error. A string can be utilised to mark the course of the dots and then later measured against the ruler for s. Taking more readings and finding average would also further eliminate the error.
These random errors could decrease the precision of the results. Thus, resulting in large percentage errors. The percentage errors calculated shows the discrepancy between the actual values and the expected values. They could have also been a result of systematic errors due to friction, mass of string, masses and slope of runway.
Since friction is not completely eliminated, there would be some resistance, causing acceleration to be lower than in the ideal situation. To compensate, the plane of the runway can be slightly downward sloping. Also, mass of string is ignored. And the masses used, due to dropping on floor, etc could cause the masses to be lower than stated. To solve, the mass can be measured and the measurements should be used to calculate subsequent readings. All these factors would cause a systematic error in the readings. Furthermore the slope of the runway is not guaranteed to be parallel to surface. Despite measuring the heights of both ends of runways and compensating for the height, using books, there could still be a slight slope that could also result in a systematic error. The experiment should be conducted on a flat surface with no ridges.
These errors result in the value being inaccurate and the graph being deviated from the origin and have a negative intercept. However, due to the scale chosen the graph is not able to accommodate the intercept.
The graph is a straight line, with a constant gradient, indicating the proportional relationship shared by net force and acceleration when mass is constant. When the force increases, the acceleration increases proportionally.
The uncertainty is rather small as only one reading was taken. If time allowed, more reading could be taken ti find the average and the uncertainty would add but would eliminate random error.
Modifying this experiment slightly, by keep the accelerating force constant, varying, instead, the mass on the trolley, the dependent variable acceleration can plotted against mass to show the inverse relationship between mass and acceleration.