4. Coping-Employee Response to Problem Customers:
It is very difficult for any organisation to satisfy every customer in each service encounter. Sometimes, customers are basically unwilling to co-operate with the service providers, other customers or regulations. In these cases, nothing the staff can do will in the 'problem customer’ feeling pleased about the encounter Therefore, when staff cope with these problem customer encounters, they should let the customer's dissatisfaction affect others less.
The Evidence of Service-Three Marketing-mix Elements
Because services are intangible, customers are often searching for any tangible evidence to help them understand the nature of the service experience. Bitner (1993) pointed out that there are three major categories of evidence experienced by the customer - people, process, and physical evidence, which are shown in Figure2-10.
- Contact employees
- Customer him/herself
- Other customers
∙ Operational flow of
activities
∙ Steps in process
∙ Flexibility vs. standard
∙ Technology vs. human ∙Tangible communication ∙ Servicescape
∙ Guarantees
∙ Technology
Figure 2-10 The Evidence of Service (from The Customer's Point of View)
Source: Biffler (1993)
-
People/Participants: The people who are involved in service production, including service organisations' staff, the customer, and other customers. These participants directly play a part in service delivery; thus their interactions strongly influence the customer's perceptions of service quality.
- Process: The method and sequence in which service delivery and operating systems work.
- Physical evidence: The environment where the service is delivered and the participants interact, and any visual, tangible components that facilitate performance or communication about the service.
These categories not only represent the tangible evidence in every service encounter, but are also critically important in managing a service encounter's quality and creating customer satisfaction. Thus, beyond the '4 Ps' model of the traditional marketing mix, marketing planners can add these three 'Ps' to optimise service management in their organisation.
Image
Beyond the discussion above, customer perceptions are influenced by impressions of the service encounter and evaluations of service evidence, which the image or reputation of the organisation can also influence these perceptions. Organisational image is the perceptions of an organisation reflected in the associations held in consumers’ memory (Keller, 1993). These associations can be very concrete, such as operation time, ease of access, or abstract and emotional, such as convenience, history, reliability, and modernity. The image can relate to the service experience itself, the service organisations, or the user of the service.
An organisation's image is build up in the customer's mind through communication, such as advertising, public relations, word of mouth, physical image, and combined actual experiences that customers receive from service delivery. A well-known and positive image is an asset for any organisation because image can impact on perceptions of quality, value, and satisfaction. If a customer has very positive image overall about an organisation, one bad experience might not be fatal. However, further bad experience will destroy the positive image. Hence, how to build or keep a well-known and positive image is of key importance for any organisation, because image can impact on customer perceptions of quality, value, and satisfaction.
Price
Service is intangible and difficult to judge before purchase; hence price is often an indicator of quality expectations and perceptions for customers. If the price is high, customers are likely to expect higher quality. However, if the price is too high or too low, customers either will not purchase or doubt the organisation's delivery quality. The price also influences customer perceptions, because after the consumption of a service, customers assess whether the benefits they received were worth the money or not.
2.4.2 How Customer Perceptions Are Organised
As Figure 2-9 shows, customers perception of services are formed by three customer-oriented terms: quality, satisfaction, and value. Nowadays, service organisations recognise that they can compete more effectively by distinguishing themselves with respect to service quality, improved customer satisfaction, and value (Zeithaml and Bitner, 1996:117). The following part of this section gives details of how customer perceptions of service are organised through these three elements.
Service Quality
“Service quality is the delivery of excellent or superior service relative to customer expectations” (Zeithaml and Bitner, 1996:117). This part focuses on the ten dimensions which customers use to judge service quality.
- Service Quality Dimensions
Research suggests that customers do not perceive quality as a unidimensional concept-that is, customers’ assessments of quality include perceptions of multiple factors (Zeithaml and Bitner, 1996:118). Many researchers bring out various dimensions of service quality. For example, the earlier work of Sasser et al. (1978) identified seven dimensions: security, consistency, attitude, completeness, conditions, availability, and training. Garvin (1987) suggested the following eight dimensions of quality are applied to all goods and services: performance, features, reliability, conformance, durability, serviceability, aesthetics, and perceived quality (roughly equivalent to prestige). Brucks and Zeithaml (1991) brought out the dimensions assessed in automobiles are - reliability, serviceability, prestige, durability, functionality, and ease of use. The most appropriate scale may depend upon the service.
Here are ten general dimensions of service quality which might be applied to variety of services, includes museum services.
-
Tangibles/Physical environment: physical evidences, such as facilities, equipment, personnel, and communication material, accompanying the service. All of these are physical evidences or images of the service that customers, especially new customers, will use to evaluate quality.
-
Reliability: ability to perform the promised service with dependability and accuracy. When the service is not performed as promised, customers' expectations for service are likely to be destroyed. When service failures occur, customers' tolerance zones will narrow and their adequate and desired service levels will rise.
-
Responsiveness: being ready and willing to provide a prompt service to customers. Responsiveness is communicated to customers by the length of time they have to wait for assistance, answers to questions, or attention to problems (Zeithaml and Britner 1996:121). It is also the notion of flexibility and ability to customise the to customer needs.
-
Competence: possession of the required skills and knowledge to perform the service.
-
Courtesy: friendliness, politeness, respect and consideration from people who have contact with customers.
-
Credibility: the trustworthiness and honesty of the service provider
-
Security: freedom from danger, risk, or doubt in the transaction.
-
Access: approachability and ease of contact.
-
Communication: keeping customers appropriately informed and listening to them.
-
Understanding the customer / Customer empathy: making the effort to understand customers and their needs.
These dimensions represent how customers organise information about service quality in their minds. Among these ten dimensions, reliability is an outcome measure, because customers evaluate it after the service experience; the others are process dimensions, because customers can evaluate them during service delivery. Knowledge of these dimensions and the ability to measure them provide organisations with the opportunity to improve service quality more effectively.
Customer Satisfaction
For many practitioners and writers, 'satisfaction' and 'quality' are interchangeable, but researchers have attempted to be more precise about the meanings and measurement of the two concepts. Current thinking brought out that the two concepts are fundamentally different in their underlying cause and outcomes. Figure2-11 (on the next page) illustrates this current agreement on the distinctions between the two constructs. As shown, service quality focuses specifically on the dimensions of service, and it is a component of customer satisfaction. On the other hand, customer satisfaction is a broader concept; it is influenced by perceptions of service quality, product quality, and price as well as situational and personal factors.
Another distinction generally drawn between quality and satisfaction is that quality perceptions can occur in the absence of actual experience with an organisation, whereas customer satisfaction can only be assessed following an actual experience with an organisation (Zeithaml and Bitner, 1996:124).
Tangibles
Reliability
Responsiveness
Competence
Courtesy Assurance
Credibility
Security
Assess
Communication Empathy
Customer Empathy
Figure 2-11 Customer Perceptions of Quality and Customer Satisfaction
Adapted from Zeithaml, V. A. and Bitner, M.J. (1996:123)
In spite of the distinction between quality and satisfaction, if an organisation performs a service with which a customer is highly satisfied, both 'service quality' and 'customer satisfaction' can lead to greater customer loyalty. Moreover, they can also provide many benefits, such as positive word of mouth, reduce failure costs, and lower costs of attracting new customers to service providers.
Perceived Value
Value is the customer's overall assessment of the whole service process and its outcome is based on perceptions of what is received and what is given. In addition to judging services on the basis of quality and satisfaction, customers also evaluate them according to their perceived value. Customers may be satisfied with their experiences
with the organisation and its service quality, but they may think it is not 'value for money'. Conversely, customers may not be very satisfied with the service experience, but they still think it was worth spending a little money on it. In other words, value is tied to customer perceptions of price and the organisations' pricing strategies.
2.4.3 Strategies for Influencing Customer Perceptions
Aim for Customer Satisfaction in Every Service Encounter
As each service encounter is potentially critical in customer perceptions of service; it is necessary to discuss how to achieve customer satisfaction in every service encounter.
∙ Plan for effective recovery: services are variable, so failures are inevitable for every organisation. When a service is a failure, the subsequent recovery efforts
create strong memories for service participants. There are four tools, Flowcharts, Control Charts, Fishbone Diagram, and Pareto Analysis (Lovelock and Wright, 1999), to help organisation in identifying failures and designing effective
recovery strategies.
∙ Facilitate adaptability and flexibility: when customers have special requirements or needs, it is necessary to know when and how the delivery system can be flexed or to explain to customers why their requirements cannot be granted. Therefore, understanding the service concept, the service delivery system, its operation and standards can help staff response to customers' special needs or requirements appropriately, so customers can still have a positive impression even when their specific request cannot be met.
∙ Encourage spontaneity: even where there is no system failure and no special request, staff behaviours can cause memorable encounters for customers. Therefore, suitable recruitment to select staff with a strong service orientation is the first step in controlling human factors. In addition, a strong service culture, employee empowerment, effective supervision and monitoring also help organisations to prevent negative behaviours happen.
∙ Help employees cope with problem customers: the 'coping' theme, as the first section classified service encounters, argues that customers can be the cause of their own dissatisfaction. In this situation, organisations need to acknowledge that the customer is not always right, and give staff appropriate training and tools to deal with problem customers as well as their own feelings. In addition, 'training customers' is also a way to tell customers how to perform their part in service delivery with appropriate behaviour.
∙ Manage the dimensions of quality at the encounter level: although the ten dimensions, tangibles, reliability, responsiveness, competence, courtesy, credibility, security, access, communication and customer empathy, are generally applied to the overall quality of an organisation; it is possible to relate them to each individual encounter. While organisations know how these dimensions create customer satisfaction, they can formulate strategies for the four themes: recovery, adaptability, spontaneity and coping. For example, if organisations aimed at improving the adaptability of staff{ it would enhance customer
perceptions of responsiveness and empathy.
Manage the Evidence of Service to Reinforce Perceptions
The evidence of service, people, process, physical evidence, are essential to make concrete the service for customers, and play important roles for creating positive perceptions. Thus, organisations should add them to the traditional '4 Ps' marketing mix.
Communicate Realistically and Use Customer Experiences to Reinforce Images
An organisation’s image can strongly impact on customer perceptions. Every organisation wants to have vivid, positive images. However, the organisation's images should be based on reality: what service can be delivered; because customers build their own image of the organisation through each actual service experience. In the long term, it is critical to manage all customer experiences to solidify the desired image.
Use Price to Enhance Customer Perceptions of Quality and Value
Prices are powerful cues for customers in forming expectations of service levels and helping them to evaluate actual quality and value received after service completed. Therefore, when pricing strategies are developed, organisations need to consider both their service positioning and communication strategies.
2.5 How to Measure Service Quality
2.5.1 Why and How to Measure Service Quality
Because service industries play an important role in many countries' economies and services are so much part of everyone's life, increased awareness of representing a good-quality service becomes an institutional and societal issue. Many organisations
acknowledge that providing superior quality can not only raise competitive ability, but earn the customers' loyalty, positive word of mouth and establish quality service images.
The first essential step towards establishing a quality culture is building a quality information system. Through a systematic collecting process, organisations can obtain data of customers’ expectations and perceptions about services; in addition, this information leads organisations to better-quality decision-making, with improved service delivery and savings in time and money as a consequence. As Berry (1995:33) says, 'Companies need to build a service quality information system, not just do a study. Conducting a service quality study is analogous to talking a snapshot. Deeper insight and an understanding of the pattern of change come from an ongoing series of snapshots taken of various subject matter from many angels'.
Many methods can build a quality information system effectively, depending on the size, the types and the financial abilities of service organisations. Possible and useful techniques include:
∙ Transactional surveys: designed to measure customer satisfaction and perceptions about service experiences they had just received.
∙ Total market surveys: measuring customers' overall service quality evaluations, which are the result of customers' accumulated experience over time. A wide range of information should be collected, including customers' service expectations and perceptions, the relative importance of the service dimensions discussed in Chapter 2-3, and the level of customers' willingness of to repurchase and make positive recommendations to others.
The tool often be used is SERVQUAL, which is discussed later Respondents are asked to complete a series of scales that measure their expectations of a particular kind of service company that would deliver excellent quality of service on a wide array of specific service characteristics. They then record their perceptions of actual service performance on these same characteristics. If perceived service ratings are higher than expectations, it is a sign of good quality; the reverse indicates poor quality. Organisations can also use these surveys to measure competitions' service quality.
∙ Mystery shopping: an organisation hires mystery shoppers to pose as ordinary customers. During visits, they observe both the physical environment and the interactions between customers and employees. This technique not only provides feedback on the performance of individual service employees, but its information can be used to reward remarkable performance or improve the design of training programmes.
∙ New, declining, and former customer surveys: declining and former customer surveys can provide helpful information about defects in an organisation's service quality. Conversely, new customer surveys provide information about what attracted them to a specific service provider, including the impact of the organisation's reputation and marketing communications.
∙ Focus group interviews involve a group of representative customers and ask them about a specific topic or issue through trained moderators or through high-tech. It is a useful way to get in-depth information about service problems and to find possible solutions. In addition, it can be used to find what criteria customers use to evaluate service quality or to get a new service idea.
∙ Staff field reporting: whereas most service quality data are collected from customers, internal communication can also produce valuable qualitative information. From staff feedback, organisations can find out what staff received from their interactions with customers and their direct observations of customer behaviour. Staff can also record critical incidents that occur during service encounters.
∙ Benchmarking (Codling, 1998:3). An organisation establishes benchmarking by:
- analysing its current position,
- adopting the standards of the best organisations in the external environment and
- learning from them how the best organisations achieve that performance, then
- adapts its own practices and processes as a result of that learning and so implements relevant changes which will effect superior performance in its own organisation.
The principle of benchmarking is that via the data of what external marketing has established as superior quality expression, organisations can improve their service quality and then gain and maintain competitive advantage.
After building a quality information system, it is essential to find ways of implementing changes for improving the quality of services. Useful techniques in this step include:
∙ Brainstorming: staff write down their opinions and these are later evaluated.
∙ Process flowcharting: a visual representation of the series of events that constitutes a particular service encounter is created.
∙ Listing forces 'for' and 'against' a proposed change: can help organisations to choose the most realistic alternative from a number of possible ways of working.
∙ Diagramming illustrates quantitative changes of an organisation's situations. It can reveal false assumptions and spread awareness of problems.
These techniques can not only improve service to the customer, but develop better internal communication which generates an excellent effect on morale and develops the wider skills of the participants.
2.5.2 Five Gaps Model of Service Quality
Zeithaml, Parasuraman and Berry have done an exploratory research study on the subject of service quality since 1983, and in the following years they also published many articles about this subject. In 1991, the book Delivering Quality Service:
Balancing Customer Perceptions and Expectations was published. This book integrates the concepts, ideas, and findings of their study. They developed a conceptual model of service quality, a methodology for measuring customer perceptions of service quality and provided many ideas about what organisations need to do to improve service quality.
Because the methodology of this dissertation is based on the Conceptual Model of Service Quality (five gaps model), it is essential to expound its concept and the methodology for measuring service quality.
Service quality is customer defined; however, between what the customer perceived and what the organisation provided exist five gaps which can influence the customer's evaluation of service quality. As Figure 2-12 (below) shows, Gap 5 denotes the service-quality shortfall perceived by customers; Gap 1 to Gap 4 are the shortfall within the service provider's organisation. The meanings of Gap1 to Gap 5 and the tools of measuring them are as follows:
CUSTOMER
Gap 5
Gap 7 Gap 6
PROVIDER
Gap 4
Gap 3
Gap 1
Gap 2
Figure 2-12 Conceptual Model of Service Quality
Adapted from Zeithaml, Berry and Parasuraman (1990); Lovelock and Wright (1999)
Note: Gap 6-7 and the box 'Customer Interpretation of Communications' are added by Lovelock, el al.
1. The knowledge gap - The difference between what service providers perceive customers expect and customers' actual needs and expectations of the service.
2. The standards gap - The difference between management’s perceptions of customer expectations and the quality specifications set for service delivery.
3. The delivery gap - The difference between the quality specifications set for service delivery and the service provider's actual performance.
4. The internal communications gap-The difference between how the organisation describes its service delivery quality in external communications, such as advertising, and what the organisation is actually able to deliver.
5. The service gap - The difference between what customers expect to receive and their perceptions of the service that is actually delivered
Although Gap 6 and Gap 7 are not included in the following methodology of measuring service quality, they are worth discussing to illustrate the comprehensiveness of the model.
6. The interpretation gap - The difference between what an organisation provided in its communications of its service delivery and what a customer thinks was promised by these communications.
7. The perceptions gap - The difference between what is actually delivered and
what customers perceive they have received (this gap is based on the notion that customers are unable to evaluate service quality accurately).
SERVQUAL - Measuring Gap 5
SERVQUAL is a multiple-item scale that organisations can use to understand better tic service expectations and perceptions of their customers. It provides a basic keleton through its expectations/perceptions measures formed by various statements vtii:ch are based on five service-quality dimensions (as Figure2-13 shows).
Original Ten Dimensions SERVEQUAL Dimensions
For Evaluating Service
Quality(mentioned in Tangibles Reliability Responsiveness Assurance Empathy
Chapter 2-4)
Figure 2-13 Correspondence between SERVQUAL Dimensions and Original Ten
Dimensions for Evaluating Service Quality
Source: Zeithaml, Berry and Parasuraman (1 990:25)
The SERYQUAL consists of two sections:
(1) an expectations section containing 22 statements to ascertain the general
expectations of customers concerning a specific service category;
(2) a perceptions section containing a matching set of 22 statements to measure customers' assessments of a specific organisation within the service category.
Each statement has seven scales, and the SERVQUAL score for each customer is computed as:
SERVQUAL Score = Perception Score - Expectation Score
Measuring Gap 1 and Gap 2
There are 20 statements in the questionnaire which are used to survey managers. These statements pertain to potential antecedents of these two managerial gaps. The specific antecedents of these two gaps are as follow:
Antecedents of Gap 1 Antecedents of Gap 2
∙ Marketing research orientation ∙ Management’s commitment to
∙ Upward communication service quality
∙ Levels of management ∙ Goal setting
∙Task standardisation
∙Perception of feasibility
Measuring Gap 3 and Gap 4
There are 30 statements in the questionnaire which are used to survey the staff who
have contact with customers. These statements pertain to potential antecedents of two gaps representing performance shortfalls on the part of contact staff. The specific antecedents of these two gaps are as follow:
Antecedents of Gap 3 Antecedents of Gap 4
∙ Teamwork ∙ Horizontal communication
∙ Staff-job fit ∙ Propensity to overpromise
∙ Technology-job fit
∙ Perceived control
∙ Supervisory control systems
∙ Role conflict
∙ Role ambiguity
Managing service quality is concerned with managing the gaps between expectations and perceptions on the part of management, staff and customers. The most important gap is that between customers' expectation of service and their perception of the service actually delivered. The factors that influence customer expectations and form their perceptions are discussed in the foregoing section of this chapter However, measuring the internal gaps (gap 1-4) is essential, because only when the organisation
has adequate communication and co-operation between managers and staff, and provides appropriate and authentic external communications for customers, can the organisation then build positive images for the long term.
3. SERVICE QUALITY IN MUSEUMS
3.1 Introduction
Museums play an essential role in post-industrial society. They preserve and illustrate history, the achievements of humanity, culture and the natural world, promote education as lifelong learning, and connect the gaps between past, current and future generations. They are as important in the economic sector. Every year, museums attract 110 million individual visits, £400 million of public funding, and involve 150,000 people working with them.
While museums have raised their profile in the last decade, they also face the trial of social trends - highly increased competition, customer-oriented, higher level and varied demands and expectations, and a more critical and educated public. Thus, some questions have been raised: what do museums do? Do they provide value for money? How well do they provide their service? All these pressures and changes lead to the awareness within museums of the need to measure their service quality.
However, how is the service of museums assessed? Many standards and indicators have been brought up by Government, specialist and scholars. These include the
Museum Registration Scheme and Quality of Service Guidelines introduced by Museums & Galleries Commission; Museums Association’s Benchmarking; Middleton suggested the five dimensions of measurement; and many such as Audit Commission, Best Value, Adams, G. D. (1992), Williams, C. (1998), and MacManus, P M. (1993) also contribute their suggestions.
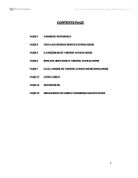
This chapter begins with a discussion of why museums need to measure their service quality. Then follows a discussion of standards, indicators and systems that were brought up by MGC and Middleton, V.T. C. The last section explores the standards and achievements in over 1,400 museums in 1997, giving a general impression of current museum services provision.
3.2 Service Issues in the Museum Sector
Middleton (1998:vi) claimed: 'In an era of massive economic and social change that is valuing all aspects of cultural life and creative sectors for their future contributions to employment generation and quality of life, museums clearly have a functional role to play in post-industrial societies'. Indeed, nowadays museums are much more than a single element of contemporary society. They not only preserve heritage for current and future generations, make important contributions to the quality of life and support education, but also help to attract tourists and contribute to place marketing and the attraction of new investment to an area (Audit Commission Local Government, 1991:43).
3.2. 1 The Status of Museums in Culture
Museums are a spiritual resource for everyone, and play a central and increasingly in important part in our cultural life. By preserving, exhibiting and interpreting collections, museums give direct access to the past, and offer a context that is far richer than anything in daily life and far wider in time.
For young generations, museums are the place to learn the history of the past. For older generations, museums can 'provide a sense of performance and stability and help to demonstrate continuity in the face of change and reaffirm traditional value (Ambrose, 1993:4). For future generations, museums are the way of combining the past with the contemporary.
The contribution of museums to the cultural sector is just as Chris Smith said, “Museums and galleries make a real difference to our lives by educating, challenging and surprising us. They open up our minds and imaginations and make a genuine
contribution to boosting local people's sense of civic pride. Our museums' collections are second to none in the world. They are part of our national heritage and are there to be enjoyed by everyone and not just the few" (Museums & Galleries Commission,
1998:4).
3.2. 2 The Status of Museums in Economy
These are more than 2,500 museums in the United Kingdom, over 1,000 of which have opened during the last 30 years (see Figure 3-1 on the next page).
Museums are the most popular cultural, educational and entertainment venues in the UK. Approximately 110 million visits are made to them each year, 40% of UK adults visit at least once a year ('regular' visitors), a further 40% are occasional visitors (Davies, 1994:49), and they are a major attraction for overseas tourists.
Period in which first
opened to public % Number of museums*
1990-1996 13 220
1980-1989 30 510
1950-1969 21 355
1901-1946 13 220
Pre-1900 8 138
100 100
Figure 3-1 Trends in The Opening of New Museums in The UK
*Number of museums responding to survey
Source: Sightseeing in the UK, 1997 UK Tourist Boards (Middleton, 1998:20)
Middleton (1998:54) suggests that the total potential market for museums and other leisure attractions over a year as follows:
- million domestic tourism nights in UK
(all purposes: source UKTS, 1996)
+221 million overseas visitor nights in UK
(all purposes: source IPS, 1996)
+1,200 million day leisure visits from home of three hours + (source UKDVS,1996)
1996)
=1,900 million potential opportunities to visit museums and other visitor attractions over a year within UK
These figures show that museums still have a large range to develop their marketing
and create more economic benefits.
In addition, museums are also the sector which involves 40,000 employees, 25,000 to 30,000 volunteers and around 100,000 members of 'Friends' organisations. Moreover, about £400 million of public funding is invested in them each year. Therefore, museums are a substantial 'industry' (Davies, 1994:5).
In summary, the status of museums in culture and the economy is, as the Department for Culture Media and Sport (1998; Selwood, 1998, b:82) expressed it. Museums contribute to four main Government objectives; they:
∙ promote education, notably through support for the National Curriculum, through formal and informal education, and by providing opportunities for lifelong learning;
∙ provide physical and intellectual access to collections which illustrate and illuminate history, the natural world, the great artistic and scientific achievements of humanity, and contemporary cultures;
∙ help to tackle social exclusion by encouraging participation in museum activity and reach across social and economic barriers;
∙ support economic prosperity by helping to sustain and regenerate communities and providing information and services for commercial and business users.
3.2.3 The Main Changes Influencing Museums Toward Providing Better Quality Service
Post-Industrial Society
As chapter two mentioned, Britain has become a post industrial society and hence a service-based economy over the last 30 years. Many areas, such as the media, education, tourism, arts and leisure, have grown fast. Some 730 museums are recorded as having opened between 1980 and 1996 (see figure 3-1 on the former page). That is equivalent to nearly one museum a week opening on average around the UK in each of the last 16 years (Middleton, 1998:20). It results in highly increasing competition among museums, particularly those providing similar collections and services close to others in the area. Similarly, it also leads to a general fall in visitor numbers (see figure 3-2), while at the same time there has been an increase in the numbers of the other venues from tourism and leisure.
Figure 3-2 Trend in Museum Visiting (at least once) over a 12 Month Period by British Adults 1988/89 to 1996/97
GB Percent visiting Number visiting
Population museums
8/89 96/97 88/89 92/93 96/97 88/89 92/93 96/97
Millions % % % % % %
All visiting 45.1 46.1 29 28 26 12.9 12.7 11.9
Male 21.7 22.4 30 29 27 6.6 6.4 6.0
Female 23.4 23.7 27 27 25 6.3 6.3 6.0
Sources BMRB/TGI (Target Group Index) survey data reproduced with permission of BMRB (Middleton, 1998:17-18)
Moreover, the population is
- of more advanced age;
- better educated and more interested in continuing education;
- retiring early;
- experiencing falling real leisure time among working adults combined with rising incomes, which leads them to seek more intensive leisure experience;
- more culturally diverse in terms of genders and ethic origin as well as in range of cultural interests;
- more travelled, for business as well as for holidays;
In brief, consumers have become more diverse, more demanding, more sophisticated,
more quality conscious and more educated. However, 'the zeitgeist of the late 20th century is consumer orientated and diametrically different from mass provision. It reflects differentiation according to people's or other user interests and needs, and it is orientated around meeting the expectations of individuals or specifically targeted groups’ (Middleton, 1998:10). In other words, while museums propose Access for All in 1990s, they are required to pay greater attention to targeting and differentiation. Auditing service quality can help museums meet the need of this specific and diversified market.
The Development of Information and Communications Technology
Undoubtedly, we are in the global information society, due to the rapid development of Information and Communications Technology in the late 1990s. This development leads to changes in the ways that customers think and conduct their lives. Through uing ICT, customers have more opportunities to gain information which provides them with more choices. Relatively, their expectations of what museums should offer become more sophisticated.
On the other hand, museums can benefit from ICT. Digital records for collection of data reduce storage space and facilitate review; the Internet provides broader access for users and communication with external environment; spread sheets simplify the process of accounting. In addition, ICT can keep quantifiable customer databases to help museums improve standards and quality of services through better and efficient monitoring of user satisfactions.
Government Attitudes, Funding & Performance Indicators
Chris Smith, the Secretary of State for Culture, Media and Sport, in one interview said: “I very much wanted to put in place four principal themes of the work of our department: the first of which was sustaining and improving excellence, the second was improving access - the more people we enable to see the best things in our art and culture the better, the third, education and the fourth, the economy. These four themes have been very much at the heart of everything I have tried to do with the department over the past 18 months” (Razak, 1999:6). His ideal shows that 'improving excellence and access' is as important as economy and education when the DCMS draws up any policies.
In July 1998 DCMS launched a paper which establishes trends that will influence museums at national, regional and local levels over the next several years. This statement signals a significant direction of policy, organisation, funding and management that will have to be reflected in the way that museums respond, individually and in partnership (Middleton,1998:30):
- Modernisation and reform
-
Best Value for public sector funding
- Investment in culture
- For the many not the few
- Regional priorities and targeting
- Education for life
- Partnerships with industry
- Enabling and facilitating
- Streamlined bureaucracy
- Economy and efficiency
- Effectiveness of outcomes
- Excellence and high quality of service provision
- Support for 'creative industries'
- Transparency and accountability
- Performance monitoring.
Among these government directions of policy, three points about the subject of this dissertation, should be pointed out: Best value, excellence and high quality of service provision, and performance monitoring.
As mentioned at the beginning of this section, museums are supported by approximately £400 million of public funding each year. Since the year 1992/1993, British central government has expended more than £ 280 millions on museums and galleries (Selwood, 1995a:23). In addition, more than £3.14 billion of lottery money was spent on celebrating the millennium and to support the growth of museum numbers; by 2001 some £ 5 billion funding will be generated for the purposes of millennium celebration, arts and heritage (Middleton, 1998:55). When the public spends so much money on museums, a basic question is brought up:
do museums give value for money?
Best value projects started in 1998; Tony Blair claimed: " Best value will mean councils being clear about their priorities and objectives, reviewing a proportion of
their services each year, examining every single aspect of a service's performance and
making year on year improvements" (Middleton, 1998:46). In the same year, one DCMS press release claimed: 'Future grants are to be tied to conditions on efficiency and access, patrolled by a new independent watchdog advising on efficiency, standards, income generation, and private sector partnership, and promoting quality and best practice' (Middleton, 1998:46). These two statements highlight the trend that funding pressures focus on performance measurement. While museums receive or unlock public funding, they will need to convince the public sector by efficiently delivering quality service.
To summarise, museums possess unchallengably important status in modem society, both in the cultural and economic sectors. However, museums are challenged by changes in modem trends. Society has become service- and customer-orientated; however, the nature of the public changes all the time. They become more diverse, individual, sophisticated, quality conscious and educated; in other words, customers are likely to be highly discriminating and knowledgeable about museum services. Through regular research of customer expectations and perceptions, museums can ensure the needs of such specific market segments are met.
Rapid growth in the numbers of museums has led to a general fall of visitor numbers in many museums, while at the same time, many types of leisure activities have been established and are successfully increasing their visitor numbers. Museums certainly need to face up to increased competition. In addition, Government and the public has become more critical and careful to identify that their money is spent effectively or not All these pressures force museums to more awareness of the need for managing their service quality to increase advantage in this competitive world.
3.3 Service Quality in Museums
3.3.1 The General Services Museums Provide
The services that each museum provides are varied. The common point is that all museums contribute to the conservation of heritage. Exhibitions and visitor support are typical forms of services that museums aim at a wide public. Other services, such as providing scholars with access to collections or examining objects, target smaller and specialised groups. Generally speaking, museums services include the following forms: (Figure 3-3 on the next page).
Figure 3-3 The Services Museums Provide
Source: Adapted from Audit Commission Local Government (199l :8)
3.3.2 The Concept of Museums Service
A visit to a museum is the museum's principal product. Because it is experiential, this product involves all aspects of the museum's operations and personnel, even other
museum visitors. As the Servuction system model (Figure 3-4 on the next page) shows, a museum product is formed by ‘invisible’ and ‘visible’ sources. The invisible sources are the museum's internal operating systems and processes. They might include the systems of exhibits collecting and stewardship, the processes of researching and marketing, or personnel management. These systems are hidden from museum users or the staff not directly involved with them. They shape and support the visible sources.
The visible sources can be divided into two types: inanimate environment and animate environment. The first is the physical surroundings of the museum, such as object labels, direction signage, shops and other facilities. The other type of visible sources is the people involved in the service encounter from staff who are in contact with users, individual users, and other museum users. This part is the most diversified factor that influences museum service delivery.
(Backstage)
Figure 3-4 The Servuction System Model as Applied to a Museum
Adapted from Hill, O'Sullivan and O'Sullivan (1998:109)
This model illustrates that a coherent and satisfying visit is formed by many factors of which some can be controlled by a museum, while others cannot. For example, a museum can decide its opening hours and what objects are on exhibition; however, a museum cannot control how much time visitors spend in the museum or what objects attract their attension. In other words, visitors control many aspects of their process.
Therefore, while evaluating the quality of museum service, understanding the progress of the complete visit experience is essential. Figure 3-5 shows the visitor journey through the museum service experience:
Visitors Previsit
PRE-VISIT Expectations
Arrival
Entry
ON-SITE
VISIT
Visitor Experience/
lmpressions
Exit
POST-VISIT Visitor Post-Visit
Actions
Figure 3-5 Visitor Journey of a Museum Service Experience
Source: Adapted from Johns and Clark (1993:362); and Adams, G. D. (1992:120)
Pre-Visit:
-
Visitors' pre-visit expectations are the basis, which forms visitors’ initial expectations of the museum, and makes them want to visit. As chapter 2-3 discussed, visitors may obtain their pre-visit knowledge from a number of sources: from word of mouth, publicity material such as advertisements, brochures and guide books, and even information in the museum's exhibit windows (e.g. passer-by visitors). It is essential that the museum provides adequate and accurate information, such as opening times, admission charges, and what exhibitions are on. It is equally important to include promotional literature and attractive pictures so that visitor can get a general image of the museum.
-
Arrival is the stage at which visitors begin to collect experiences to compare with their preconceived expectations. Important factors include signposts, location instructions, car parks, public transport and the gate of the museum.
On-Site Experiences
-
Entry is the first stage at which visitors encounter the actual service offered by the museum. It is also the starting point for ‘moments of truth’: visitors interact with staff Visitors may be required to pay admission fees and deposit bags and clothing. Sometimes staff may need to briefly introduce the exhibition and give directions. It is very important that staff contact with visitors is friendly and courteous, and notices the special needs of visitors, such as those of disabled people or visitors with young children or babies.
-
Visitors’ experiences and impressions: a visit experience of the museum 'product' is very personal in nature. At this stage, visible facilities and equipment mostly form visitor perceptions. Visitors may wish to see certain exhibits, and use guides or a guided tour. A school group needs workshops and teaching materials; a family group is interested in doing children's quiz. Some interpretation panels may attract visitors' attention. Establishing pathways through the exhibits often enhances visitor experience. Clear internal signposting, a logical layout, and good object labels contribute to good impressions for visitors.
In addition, visitors may use other facilities, such as shops, toilets, seating, and restaurants. The locations and cleanness of these facilities are also a part of visitor evaluations. Shops are increasingly an essential feature of museum visits. They not only make visitors' transient experience of a museum visit more memorable through 'souvenirs', but also can also benefit museums in the financial sector and open up new possibilities of audience development.
-
Exit from the museum is as important as entry. Visitors may meet staff again, such as when they collect their bags, return hired items, and they wish to be treated as welcomingly as when they entered. The signposts dearly indicate that the way out may also be as critical to visitor satisfaction as those encountered on arrival.
Post-Visit:
- When a visit is concluded, some of the visitors have dominant impressions, others have not. Visitors may share their experience with others through either positive or negative word-of-mouth. Providing follow-up information about the museum to visitors can be an opportunity to encourage repeat visits.
On the pre-visit level, all the information about museums that visitors obtained form their expectations and contribute to a decision of whether to visit or not. Target groups research helps museums to understand visitors' desires and tastes about which services or atmospheres visitors seek, such as tour guides, and having fun. Museums can use this information to develop publicity and advertising themes that position museums to advantage in the marketplace. The second level comprises the visitors' on-site experience. How to present museum service in a way that will satisfy the visitors' expectations is the main mission for museums. Regularly and systematically collecting visitors' overall evaluations of their visits is the critical mission for museums. The final level focuses on the visitors' post-visit impressions and how they act upon them. After museums collect the information on visitors' evaluations, they should attempt to monitor how well they are meeting visitor expectations and improve their services. Providing follow-up information for the public can help museums to build the images of quality service in the long-term.
The questionnaires in chapter five were based on these concepts and attempted to analyse museum’ service quality from the visitors' point of view.
3.3.3 Performance Measurement in Museums
As discussed earlier, the museum sector has faced public pressure and become more aware of the responsibility of performance management in the last two decades. How to measure museum service performance forms the debate, which has been discussed for a long time. Many standards and indicators have been brought up. The following are the most common and useful for many museums to adopt.
The Museums & Galleries Commission introduced a Museum Registration scheme in the late 1980s with the assistance of the ten Area Museum Councils. It is now recognised as a national minimum standard for museums in the United Kingdom. The MGC's work is to raise museum standards and help all types and sizes museums to demonstrate that they share a common basis of operation. The main requirements of this minimum standards scheme are (Museums & Galleries Commission, 1995:2):
- conformity with the Museums Association definition of a museum (see Chapter 1.3.2) , or if appropriate, the Museums and Galleries Commission's definition of ‘national’ museum;
- an acceptable constitution;
- a clear purpose and a planned approach to management;
- an acceptable statement of collections management policy;
- an acceptable provision for the care of collections;
- public services appropriate to the nature, scale and location of the museum;
- regular access to professional curatorial advice;
- an acceptable financial basis, and compliance with legal planning and safety requirements.
In consideration of the changes in customers' expectations and wishes are set at a higher level in the l 990s, MGC published a booklet - Quality of Service in Museums and Galleries -Customer Care in Museums Guidelines on Implementation in 1992. The guidelines amplify the code on The National Tourist Board's Code of Practice for Visitor Attractions and place it in a museum context. The MGC (1992) lists the following sectors of management:
- Museum Practice;
- Collections Management;
- Customer Care Policy;
- Access;
- Marketing;
- Display and Education;
- Training;
- Museum Support on Site Care;
- Safety; and
- Monitoring and Evaluation.
Each sector includes various items to indicate the quality of service which museum should be aiming at. The guidelines set out ways in which this quality is to be achieved and are designed to help with the forward-planning process and the setting of performance indicators.
In December 1997, the Museums Association published the paper Benchmarking -Museums Briefing. This briefing provides its members with information on a wide range of common activities and practices taking place in a cross-section of museums in the UK. The statistics included several sectors, such as admission charges, access, financial benchmarks and staffing. Although the MA claimed that the information on the leaflet 'is not intended to be taken as recommended levels of performance and should not be seen as best practice within museums', it shows what is actually happening in museums today.
Moreover, the report of Middleton (1998:48-49) suggested that a basket of performance measures should be considered. He wrote: ‘the role of museums in society is much deeper than that of visitor attractions and the measures needed to assess performance are therefore more complex. …Accordingly five dimensions of measurement are identified as relevant to assessing museum performance’. The five dimensions are:
-
Curatorial performance, including how well collections are documented, accessible, maintained and preserved;
-
Meeting user needs; the knowledge of visitor or user profiles, research of visitor satisfactions and enjoyments, what services users expect from museums;
-
Efficiency and effectiveness of services provided for visitors (operational performance): specific audits of the visitor services quality evaluated against agreed standards. The assessment may include promotional literature for the public, signage to the site, the quality of reception and admission, the effectiveness of interpretation and display, and the quality of facilities for retail and catering;
-
Effectiveness of management and synergy with other organisations: are business and marketing plans effective? flow many and what types of partnership have been achieved and how they benefit museums;
-
Statistical and business performance measures and ratios: annual and monthly numbers of visitors, and visitors by type (school, where from, the elderly, ethnic minority groups), non-visitor related revenue by category, revenue broken down by the main category of users.
Other standards or performance measurement systems have been established. It is not suggested that museums should adopt each of them. However, museums may establish their own standards by using standards, which have been developed externally. Middleton (1998:49) suggested; ‘MGC Registration procedures can be used as a sound platform for developing curatorial measures. A voluntary quality assurance inspection scheme would provide operational measures. Participation in a data exchange such as AIM's Comparative Trading Survey provides key statistical and financial measures and the DOMUS annual questionnaire could be developed to record progress’. Measuring performance against standards can assist managers and staff in gauging the success of their institution and their own achievements.
3.4 Current Museum Services Provision
The Museums & Galleries Commission, the leading standards body for museums in the United Kingdom, has been developing and promoting standards within museums for many years. In 1988, MGC launched the Registration Scheme, which set out minimum standards for museums, and galleries in terms of collection care, public and visitor services and management. By June 1998, a total of 1,742 museums and galleries had met registration standards.
In order to provide an authoritative source of information about the museum sector, the MGC developed the DOMUS database (Digest of Museum Statistics) in 1994. Four years later Museum Focus was published. This issue which is based on the 1997 annual survey of museums in the UK, and provides a general overview of museum standards and achievements. Thus, this section of the chapter excerpted some parts of this data to give a general image about current museum services provision.
The following data was gathered according to its subjects rather than the original data, which followed the different surveys. Thus, the numbers of respondent museums are different. Moreover, although Museum Focus shows the results by seven museum types (armed services, English heritage, independent, local authority, national trust, university), the researcher only excerpted the data of independent museums and the total result, in order to focus on the subject of the thesis.
Furthermore, in the ‘Access’ part, the researcher also excerpted data from
Benchmarking-the briefing of the Museums Association, to give more information about admission fee in museums. This data is based on the sample of 36 museums drawn from local authority, independent, military, national and university control.
ACCESS
1. Opening Times
According to the MGC's Registration Guidelines, registered museums exist to provide a public benefit, and should be open to the public at convenient times and for reasonable periods. Museum opening times affect how easily the public can visit. As Figure 3-6 shows, over half of independent museums are fully open to the public for 10-12 months. However, it is under the level of the percentage of total museum opening times.
Figure 3-6 Months Fully Open to The Public
Independent Total
% %
0 months 6 6
1-3 months 1 1
4-6 months 17 10
7-9 months 24 18
10-12 months 52 65
Valid responses 100 100
Base museums number 570 1,443
Source: Museum Focus, MGC (1998)
The data for seasonal opening hours (Figure3-7) shows a wide divergence between summer and winter opening times. 41% of museums opening hours were more than 40 hours per week during the summer whereas the number drops by almost half during the winter. This gap becomes even bigger for independent museums. In addition, over 40% of independent museums were not open at all during the winter
Figure 3-7 Summer/Winter Opening Hours Per Week
Summer Winter
Independent Total Independent Total
% % % %
0 hours per week 7 7 44 32
1-10 hours per week 14 7 11 6
11-20 hours per week 10 7 10 8
21-30 hours per week 14 12 9 11
31-40 hours per week 20 26 13 20
Over 40 hours per week 35 41 12 23
Valid responses 100 100 99 100
Base museums number 570 1,443 570 1,443
Source: Museum Focus, MGC (1998)
Figure 3-8 shows that over 60% of independent museums were open on Saturdays, Sundays and bank holidays. Compared with the percentage of total museums opened at these times, it is higher than the average level. General speaking, independent museum opening times make them easier for working people to visit who can only visit during the weekend or in the evening.
Figure 3-8 Opening Times
Independent Total
% %
Regular evening openings 13 15
Open on Saturdays and Sundays 60 57
Open on Saturdays only 18 23
Open on bank holidays 63 59
Valid responses 100 100
Base museums number 566 1,434
Source: Museum Focus, MGC (1998)
2. Public Services and Facilities
Although registered museums need to meet certain minimum standards in the provision of public facilities, the standards are less rigorous than others applying to collections’ care or management. This is due to the varied nature of the museum sector the physical and other circumstances of each museum site. For example, a museum in a fifteen-century historical building may not be able to provide catering, toilet or disabled facilities. However museums should clearly and honestly provide this information to the public so that they can make an informed choice.
Figure 3-9 (below) shows the range of visitor facilities provided by independent and total respondent museums. Most museums provide toilets, shops, education services and temporary exhibition space. Only less than 20% of museums have baby care facilities. The percentage of each item in independent museums is similar to the average percentage of total respondent museums.
Figure 3-9 Facilities
Independent Total
% %
Baby care facilities 14 19
Disability facilities/services 45 48
Education facilities/services 52 60
Meeting room 44 45
Private function facilities 26 30
Public car park 50 48
Restaurant/cafe 34 33
Shop 77 79
Study facilities 38 41
Temporary exhibition space 54 59
Toilets 76 80
Valid responses 100 100
Base museums number 570 1,443
Source: Museum Focus, MGC (1998)
3. Admission Charges
Admission charging has become a hotly debated subject recently. However, it is generally accepted that for many museums, admission charges are a primary method of generating income. As Figure 3-10 (on the next page) shows, less than half of total respondent museums did not have admission charges, whereas nearly 70% of independent museums did. This discrepancy is because only 12% of university and 32% of local authority museums have charges; or maybe the fact of a budget announcement two years ago (1998) that £ 2 million had been found to keep non-charging national museums free also contribute to this divergence.
Figure 3-10 Museums with an Admission Charge for Their Core Collection
Independent Total
% %
Museums with an admission charge 68 48
Valid responses 100 100
Base museums number 570 1,443
Source: Museum Focus, MGC (1998)
According to the Museums Association's statistics, 23 out of 36 respondent museums have admission charges. Among these charging museums, most provided concession for children, students, OAPs, the unemployed and disabled visitors. In addition, typical charges for applying to Friend's organisations were between £ 5 and £ 10 (Figure3-11).
Figure 3-11 Admission and Friends' Organisations' Charges
Admission charges Range Typical Range Notes
Adult £1-£8.5 £2- £4.8
Child £0.5-£6 £1-£3 All charging museums provided.
OAP and student £0.5-£0.7 £1-£1.25 4/5 of charging museums gave a
concessionary admission.
Unemployed £0.5- £4 £13 2/3 of charging museums gave a
concessionary admission.
Carers of visitors with
disabilities £1-£4 £1.65 1/2 of charging museums gave a
concessionary admission.
Annual subscriptions
to Friends' organisations This result is based on 36
museums
for a single adult £5-£25 £5-£10
Source: Museums Association (1997)
POLICIES and PLANS
Museum policies and plans give a prospect of how museums intend to provide their services to public.
1. Collection Management Policy
A collection management policy ensures that important management decisions can be taken within the context of priorities, which have already been agreed by the museum's governing body. Figure 3-12 (below) shows that over 65% of respondent museums had a collection management policy.
Figure 3-12 Museums with a Collection Management Policy
Independent Total
% %
Museums with a collection management policy 65 66
Valid responses 100 100
Base museums number 570 1,443
Source: Museum Focus, MGC (1998)
2. Education, Disability and Visitor Care Policies and Plans
Around a third of total respondent museums had policies and plans for education, and about a quarter for disabled access and visitor care. In comparison to the two thirds of museums, which had a collection management policy, it is clear that many museums do not regard education, disability access and visitor care as a priority.
Most museums had separate policy and planning documents for education, disability access and visitor care; these policies where not integrated in their forward plans or
endorsed by governing bodies. In addition, fewer museums had action plans than had
policies. The results are similar in independent museums (Figure 3-13).
Figure 3-13 Education/Disability/Visitor Care Policies and Plans
Education Disability Acces Visitor care
Independent Total Indepen. Total Indepen. Total
% % % % % %
1.A written Policy 33 38 22 28 23 27
which is endorsed by governing body 21 25 15 18 14 16
which is an internal part of
forward plan 24 29 15 20 17 21
2.A written action plan 24 31 16 23 19 24
with short-term objectives (1-3 years) 20 26 13 18 16 21
with long-term objectives (3-10 years) 10 12 8 10 10 11
Valid responses 100 100 100 100 100 100
Base museum number 566 1,434 566 1,434 566 1,434
Source: Museum Focus, MGC (1998)
STAFF and TRAINING
Staff, whether paid or voluntary, are of key important where museums provide their services to public. Sufficient staff training can ensure that services are delivered appropriately Figure 3-14 shows that just over a quarter of museums had a formal staff training policy. Only 19% of independent museums had such a policy. It is a poor percentage if compared with the 80% of national museums, which had one.
Figure 3-14 Museums with a Staff Training Policy
Independent Total
% %
Museums with a staff training policy 19 28
Valid responses 100 100
Base museums number 570 1,443
Source: Museum Focus, MGC (1998)
A lower percentage of museums provided staff training in education, then disability access and visitor care. However, a higher percentage of museums had specific staff responsible for education than for the other two areas of work. Figure 3-15 also shows that the percentages of independent museums providing training for staff in these three areas are lower than total average levels, especially in disability and visitor care. Similar results are also found for staff with specific responsibility for education, disability access and visitor care.
Figure 3-15 Public Services Staffing
Education Disability Access Visitor care
Independent Total Indepen. Total Indepen. Total
% % % % % %
Staff training in 23 29 20 32 34 46
A member of staff with specific
responsibility for 41 47 15 22 27 33
Valid responses 100 100 100 100 100 100
Base museums number 566 1,434 566 1,434 566 1,434
Source: Museum Focus, MGC (1998)
EDUCATION PROVISION
Anderson (1997) claimed 'Museums have entered a time of change. …The cultural sector offers opportunities for informal and self-directed learning that differ from, and complement, the learning provided by the formal education sector. Education provides museums with a renewed purpose and enables them to contribute to cultural development in society' (Middleton, 1998:38). The concept of education for life has already generated a tidal wave of development that is benefiting some, mainly large, museums. These data give an image of museums' education provision.
Figure 3-16 Education Provision
Independent Total
% %
General
Exhibitions/evens with structured educational input 42 52
Reception/lunch facilities for educational groups 38 32
Loan services 29 34
Other off-site/outreach services 32 41
Events/teaching/resources for people with disabilities 14 23
Events/teaching/resources for ethnic minority communities 4 12
Work experience opportunities 45 55
School and other formal education sectors
Direct teaching services for schools 32 42
Printed/audio-visual information for schools 40 48
Teaching/resources for FE and HE students 25 32
In-service training programmes for teachers 18 30
Organised research facilities for students/teachers/academics 27 29
Academic conferences/study days/other events 22 28
Academic publications/resources 24 27
Children and young people
Activities/materials for pre-school children 19 23
Services for children (aged 5-12) 56 62
Services for teenagers (aged 13-18) 38 42
Events/resources for families 32 41
Adults
Lectures/courses 46 47
Other resources 17 19
Museums with 6 or more types of education provision 44 55
Valid responses 100 100
Base museums number 566 1,434
Source: Museum Focus, MGC (1998)
Figure 3-16 (on the previous page) shows that the most common form of education
provision was services for children (aged 5-12). Over half of museums offered work experience opportunities and exhibitions or events with structured educational input to the public. The percentage of forms of education provision in independent museums are generally lower than total average percentage. Only the percentage of ‘reception/lunch facilities for educational groups’ is higher than average level.
VISITOR CARE and RESEARCH
Around 60% of overseas tourists visit the UK for its museums and galleries (Selwood, 1995, b). Information in foreign languages contributes to the quality of their museum visits (Coles, Hurst and Winsor, 1998:30). It is clear that one in four independent museums had brochures or leaflets or museum plans in foreign languages. A similar percentage was found in total respondent museums. No independent museums had information terminals in foreign languages, and only 1% of total respondent museums provided them (Figure 3-17).
Figure 3-17 Foreign Languages
Independent Total
% %
Brochure / leaflet / museum plan 25 23
General guide to the collections 10 9
Interpretation panels / object labels 5 6
Information terminals in or outside exhibition spaces 0 1
Audio guide 3 2
Lectures 2 2
Museums providing at least one item in a foreign Language 33 30
Valid responses 100 100
Base museums number 566 1,434
Source: Museum Focus, MGC (1998)
There is a huge range of services and facilities, which museums can provide to make the experiences of visitors and users more enjoyable, and which can contribute to developing new audiences. As Figure 3-18 (below) shows, most museums provided basic visitor information, such as object labels (83%), directions to the museum (77%), and interpretation panels (73%). Only 2% of museums provided CD-ROM guides and 8% had audio guides.
Figure 3-18 Visitor Care Provision
Independent Total
% %
Direction signposting outside for museum 78 77
Direction signage inside the museum 52 55
Brochure/leaflet with directions to the museum 80 78
Museum plan 34 34
General guide to the collections 47 41
Specialist publications on the collections 31 33
Listing in tourist board publication 76 76
Pre-booking for groups 81 81
Interpretation panels 66 73
Object labels 82 83
Information terminals/computers for public use
in exhibition spaces 10 12
Information terminals/computers for public use
outside exhibition spaces 4 4
Audio guide 8 8
CD-ROM guide 2 2
Object identification service 34 50
Written enquiries service 64 74
Facilities to see objects not on display 56 64
Facilities to study objects 47 54
Library with public access 34 33
Public access to the museum's documentation system 18 16
Website 19 21
Valid responses 100 100
Base 100 100
Source: Museum Focus, MGC (1998)
Research can help museums to develop provision which will cater for users' needs and attract non-users. However, less than half the respondent museums had surveyed for a user profile during the previous five years. Only 20% of museums had researched non-users. By comparison, 45% of total respondent museums had written procedures to deal with complaints; a much lower percentage (15%) of independent museums had these procedures (Figure 3-19).
Figure 3-19 User and Non-users Research
Independent Total
% %
Survey of user profile during the last 5 years 44 48
Research into non-user needs / views in last 5 years 14 20
Written procedure to deal with complains 15 45
Valid responses 100 100
Base museums number 566 1,434
Source: Museum Focus, MGC (1998)
In conclusion, the purpose of this section is to give a general impression of current museum service provision; from the perspective of how the museums themselves evaluate the quality of their services to the public. However, the standards for each museum may differ due to the various nature of the museum sector and the physical and other circumstances of each museum site. The key point is that developing the image of quality service relies on regular research in public expectations and perceptions of museum services.
4. CAMBRIDGE AND COUNTY FOLK MUSEUM
4.1 Introduction
The museum aims to communicate the history and way of life of the people of Cambridge and its neighbourhood through the interpretation of its collections and the their historic setting for the education and delight of all. (Cambridge and County Folk Museum mission statement, 1999).
Historical Background
Cambridge and Country Folk Museum is located in Castle Street in Cambridge, and housed in a 5th, 16th century inn. It was opened in 1936 with the 'primary object....to interest the ordinary citizen in aspects of local social life which are disappearing in Cambridgeshire under changing conditions' (Hawke-Smith, 1999:5). This illustrates that from the beginning the education role was paramount. The Folk Museum is an independent trust museum, and trades as a limited company with charitable status. In the early days its operation relied almost entirely on donations from a number of Cambridge colleges and private individuals. Visitor numbers had never exceeded 5000 before 1960, but they grew steadily over the 60s, 70s and 80s and reached a peak of 22,000 (for all users) in 1987. During these decades, despite increasing visitor numbers, finances remained insecure and were underpinned by Local Authority grants. In addition, the problem of the lack of adequate storage and exhibition space grew more extreme.
Management Body and Staff
The Museum's strategic management body is formed by the Friends of the Cambridge and County Folk Museum and the local authorities. At the present time there are five full and part time staff, who carry on day-to-day management: the Curator (ft); an Assistant Curator (ft); a Museum Assistant (ft); an Education Officer (pt), and a Designer (pt). In addition, there are about 20 volunteers (10 of them are regular) who
take the responsibilities of accountancy, some documentation work, reception duties and cleaning. The value in cash terms of this direct contribution, as described in Forward Plan 1999-2004, is estimated conservatively at £20,000.
The Museum Building and Collections
The Grade II listed building consists of three main elements: a two and a half storey original building which includes nine display rooms, shop and reception, a yard, and a later rear extension building which is used as office and main stores. The property was licensed as The White Horse Inn in 1646 and remained in use as a public house until 1935.
The building itself is a most important social history exhibit, reflecting changes of use over several hundred years. It contains a number of rooms with historic objects illustrating the lives of ordinary people in Cambridge and its neighbourhood from sixteenth century. Of the nine display rooms, two are used for temporary exhibitions which are usually held three times on different themes each year.
Current Situation
As the Folk Museum has entered the new millennium in its 65th year, the current curator Cameron Hawke-Smith, who has served in this post since March 1999, is preparing plans for a period of major redevelopment. The Museum had (at 26 May 1999) full registered status (pending action) with the Museums and Galleries Commission. It means the Folk Museum has achieved agreed minimum standards in museum management, collection care and public services.
Through the year 1999-2000, the Folk Museum was running a multi-media project; This is Your Cambridge, with support of the Heritage Lottery Fund and the City Council, as part of the Millennium Festival.
The population of Cambridge is 113,800 residents, includes 20,000 students resident in term time. Every year around 3.3 million people visit Cambridge and this number is growing (Cambridge City Council, 1996:9). Visitors to museums reflect (i) the very high absolute numbers of overseas and U.K. visitors, and (ii) the relatively high proportion of local residents in professional, administrative and managerial jobs. Both factors should help to increase visitor numbers above the average in Britain for a small museum of this kind (Hawke-Smith, 1999:7). However, in the five years from 1993-8, total visitor numbers for the Folk Museum have declined from 16,137 to 11,297. (Huang, 1999:22) This trend has continued through 1999. Although the Museum's visitor surveys show the majority of visitors have been inspired to come by recommendation from others, the long term decline of visitor numbers must reflect fundamental shortcomings in the quality of the visitor experience. Therefore, reevaluating the Museum's service quality is urgent and essential during the Folk Museum redevelopment.
This chapter begins with a review of the Museum's current service provision, listing and comparing with MGC - registered independent museums, mentioned in chapter
3-4. This is followed by evaluations of current visitors from the bi-annual visitor surveys in 1997-99. Finally, the curator's plans to improve the Museum's service quality to public are explored.
4.2 Current Services Provision of the Folk Museum
Compared with the other independent museums which are registered with the MGC (see chapter 3.4), Cambridge & County Folk Museum's services provision can be described in the following ways.
ACCESS
1. Opening Times
The Folk Museum opens 12 months a year, every day of the week in summer (April to September), Tuesday to Sunday in winter (October to March), plus Mondays in school holidays and bank holiday. The opening hours are 10:30am to 5pm, Monday to Saturday, 2pm to 5pm, Sunday. Last admission is at 4:30pm. The Museum can be opened for booked parties any evening of the year. The Folk Museum's opening times are similar to those of most other independent museums. However, it provides more accessible times in winter than the majority of independent museums.
2. Public Service and Facilities
Currently the Folk Museum's public facilities are (i) disability facilities: partial access for the disable (ground floor), taped guide or Braille guide for visually impaired visitors; (ii) education facilities and services; (iii) a shop; (iv) temporary exhibition space. Compared with other independent museums, the Folk Museum does not provide the most common facilities which over half independent museums do, such a public car parking (50%) and toilets (76%).
3. Admission and Friends' Organisation's Charges
The full adult charge is £ 2.00 with concessions at £ 1.00 for senior citizens, students, and disabled people, children 50p, families £ 5.00, schools 50p to £ 2.00 per child. In addition, the Museum provides half price for visitors who have a Cambridge City Leisure Card or a ticket of Guide Friday Bus Tours, and free entrance for Friends and Museum Association Members.
Individual annual subscriptions to the Friends' organisation is £ 8.00; prices for students, juniors, senior citizens and families vary from £ 3.5 to £ 10. According to the Museums Association's statistics (see Figure 3-11), these charges are similar to those of other independent museums.
POLICIES and PLANS
The curator of the Folk Museum has completed the five-year forward plan (1999-2004) which includes four policies: (i) acquisition and disposal policy (collection management); (ii) education policy; (iii) policy statement on access; and (iv) policy statement on equal opportunities. There is no specific policy for disabled access and visitor care; both of these are covered in the policy statement on access.
STAFF and TRAINING
There is no particular staff training policy. The related strategies of recruitment and employment practice are involved in Policy Statement on Equal Opportunities and Policy Statement on Access. The Forward Plan 1999-2004 mentions that ‘junior members of staff are actively encouraged to acquire formal qualifications in the museum field, and are given paid leave to undertake this. All members of staff take part in on-going training as part of their continuing professional development, and this could be extended to volunteers as appropriate’. Currently the Folk Museum has one part-time education office.
EDUCATION PROVISION
The Cambridge & County Folk Museum 'was founded in 1936... and from the first had a started educational role. The quality, diversity and accessibility of the collections make them particularly valuable for this purpose' (Hawke-Smith, 1999, in Education Policy). Thus, Folk Museum provides many services which are listed on the MGC's questionnaire (see Figure 3-16). These services are:
1. General
- Exhibitions/events with structured educational input
- Loan services (schools and reminiscence therapy)
- Other off-site/outreach services (external exhibitions, evening talks, working with other groups, such as libraries, other museums)
- Work experience opportunities (placement for students from school, college and university
2. School and Other Formal Education Sectors
- Direct teaching services for schools
- Printed visual information for schools (worksheets)
- Teaching/resources for FE and HE students
- In-service training programmes for teachers
3. Children and Young People
- Services for children (aged 5-12)
- Services for teenagers (aged 13-18)
- Events/resources for families (holiday workshops and Saturday activities)
4. Adults
- Lectures/courses
- Other resources (evening guided tours for staff and members of the Friends)
VISITOR CARE AND RESEARCH
1. Foreign Languages
Eight foreign languages are used in the Museum's brief guide, including French, German, Dutch, Chinese, Japanese, Thai, Italian and Arabic. Brochures, leaflets, interpretation panels, object labels and lectures are only in English.
2. Visitor Care Provision
Like other registered independent museums, the Folk Museum provides basic visitor care facilities and services. They include direction signposting outside for the Museum, direction signage inside the museum, brochures and leaflets with directions to the museum, a general guide to the collections (brief guide), listings in tourist board publication, pre-booking for groups, interpretation panels, object labels, and facilities to see objects not on display. The Folk Museum has difficulty in providing several services and facilities listed in Figure 3-18, such as a library with public access and specialist publications on the collections of limited building space, and of staff and financial constraints.
3. User and Non-Users Research
Folk Museum has collected visitor surveys over ten years, usually twice a year.
Generally speaking, the Folk Museum's service provision is similar to the other registered independent museums. The Museum provides more accessible opening times in the winter, and more education services and facilities than average provision in other independent museums. In addition, the twice a year visitor survey to collect visitors' background and their evaluations of the visits is one of the Museum's merits. However, the Folk Museum does not have specific policies for disability access and visitor care, nor specific facilities for disabled visitors to access all exhibition rooms.
4.3 The Current Circumstances of the Folk Museum’s Performance
The Cambridge & County Folk Museum has collected visitor data through bi-annual surveys (in winter and summer) over ten years. Each time the Museum collects about or over one hundred visitors' opinions. 'The statistics have been refined year by year and it has been suggested that some of the figures in the past were exaggerated. The current records are more accurate and also document separately and in some detail the people using the museum who are not simply visitors through the door, i.e. those using loans boxes, viewers of external exhibitions, etc' (Hawke-Smith, 1999:7). These statistics not only provide data on visitors' background, but also reflect their evaluations of the Folk Museum's service. Part of the results from the years 1997-99 are shown as following.
Party Type
Most visitors came with family groups. Among the types of 'with group', about 20% to 30% of visitors came to the Museum with friends. Party type can influence visitors' expectations and evaluations. Children want to have fun, they need something with which they can interact, such as quizzes or examples. Parents may expect museums to provide more facilities, such as toilets and a cafe, than other adults who come along. In addition, the visitors who came alone may need more detailed interpretation of objects.
Where do Visitors Live?
The Folk Museum has high proportion visitors who come from the rest of Britain or abroad. Overseas visitors rnay be more satisfied since the Museum provides guides or labels in foreign language. Non-local visitors may make it a priority to choose those museums where they easily obtain information when they seek a museum to visit. In other words, appropriate, attractive and authentic information about the Folk Museum is important as potential audiences form their expectations of the Museum.
How did Visitors Find out about the Museum?
The most common way that visitors found out about the Museum was through word of mouth. Word of mouth recommendation is one of the most effective marketing techniques. Some statistics reflects that visitors had good experiences in the Museum, thus they are willing to recommend it to their friends or relations. Nearly 20% of visitors obtained information from guide books; this may be due to the high percentage of visitors from the rest of UK or overseas. in addition, ‘passed by’ is the other common way that visitors found out about the Museum. This result shows that the Folk Museum is in an advantageous location.
How Much did Visitors Enjoy Their Visit?
40% of visitors described their visits as 'very good', and around 40% of them felt they were 'excellent'. Only fewer than 5% of visitors judged their visits as 'fair' or 'poor'.
Did Visitors Think that a Visit to the Museum is Value for Money?
When respondents were asked to answer 'yes' or 'no' to the question 'do you think that a visit to the Museum is value for money?', over 92% of them ticked 'yes'. This illustrates that the admission charge is appropriate at present, although a few people had been dissuaded from coming in. Additionally, respondents thought it was worth spending this amount of money on the current service they received from the Museum.
The Folk Museum has added three open answer questions on the survey since the 1997 summer survey The answers show a wide range of difference. The original questions and the most common answers which are grouped into ten dimensions, are shown as following.
What Aspect of Your Visit did You Enjoy the Most?
1. physical environment
- exhibitions in different rooms, especially in the Children's Room
- the building
- children's quiz
2. courtesy
- friendly atmosphere or staff (receptionists)
3. customer empathy
- welcome/volunteer (receptionist)
Was There any Aspect of Your Visit that You Disliked?
1. physical environment
- stairs
- labels (out of date, not detailed enough)
- temporary room did not open or nothing there
∙ heating
∙ no toilet
2. access
∙ cluttered rooms/inaccessible to the disabled
Is There Anything the Museum Could do to Improve Your Visit?
1. physical environment
- provide toilets
- more details on labels, better exhibits
- more illustration/explanation about exhibits
- guide book/taped guide/guided tours
- cafe, tea room
- more interaction, touch the toys
2. access
- lift
- disabled facilities to upstairs
To summarise, a high percentage of visitors come from the rest of Britain and overseas. The most common party type is with family. These visitors' backgrounds should influence the Museum to consider the height of exhibits, the need for more illustrations or signs in foreign languages when displaying its objects.
A high level of visitor satisfaction is reflected in the surveys. The dimension of physical environment is critical to forming visitor evaluations. Relatively, it is the element which most causes visitors to dislike their experience. Impressively, visitors gave a high assessment of the performance of staff/volunteers.
4.4 The folk Museum’s Future Plans for Improving Its Service
In the Forward Plan 1999-2004, the curator Hawke-Smith (1999:10) mentioned that 'related problems, which are becoming less and less easy to live with, are to do with the provision of adequate facilities to manage and display the collections satisfactorily and to cater for the needs of today's audiences'. The problems that currently exist in the Museum are:
(i) lack of storage place, thus a high proportion (about 60%) of the collections are on public display which results less effective interpretation and unsatisfactory environmental conditions;
(ii) there is no designated space for education groups;
(iii) limited access for disabilities
(iv) limited basic facilities, such as no toilets for visitors;
(v) the ten-year decline in visitor numbers.
The plans which relate to improving service to public are briefly described as following.
Collections
There are about 40,000 items in the Folk Museum. The key elements in the redevelopment programmes for collections are:
- the documentation and re-interpretation of the collections;
- the provision of new and enlarged storage and associated workspace.
In addition, in order to provide a better environment to conserve the collections and display better quality exhibits, the Museum is seeking temporary accommodation for the collections and handling whilst the old stores are being replaced and the building works are on-going within the Museum.
Building
The display building is Grade II listed, it is the most important social history exhibit the Museum has. Therefore, there can be no question of altering it or extending it in ways that would be detrimental to its character. However, the building needs some remedial attention: part of the timber structure is visibly decayed and current security
system is not adequate. In order to conserve and better explain the Museum building to public, it is essential that the following work is defined.
∙ environmental specifications;
∙ working space requirements;
∙ comprehensive building survey;
∙ review of security/ fire protection.
Interpretation
The staff is planning to undertake further market research of the Museum's present and potential audiences to establish in what ways the interest of the site and collections can best communicated. Any proposals for the reinterpretation and display of the museum wilt be thoroughly tested, especially against local opinion. Various interest groups, such as the Friends, Local Authorities, SEMS, funders, local teachers, other museum professionals, tourism specialists, and so on3 will be approached to give help on these matters. Findings could be used in conjunction with those of the museum visitor surveys to reach a balanced view.
Access and Visitor Care
The Museum is planning a web-site and will responsive to developments in ICT. In addition, the curator mentioned the following strategies to improve the Museum's access and visitor care in his forward plan.
∙ to maintain the current opening hours and review them on an annual basis, making changes where warranted
∙ to extend and revise the current access audit in conjunction with the museum’ development plan
∙ to continue to seek external funding for the redevelopment of the museum to provide visitor facilities, such as toilets for general visitors and disabled people, elimination where feasible of physical barriers to access to the displays and stores, and improved intellectual access
∙ to continue to market and develop temporary exhibitions, reminiscence and schools loans, outreach exhibitions, talks to groups and multi-media presentations
∙ to continue and refine visitor, user and non-user surveys and adapt to their findings
∙ to maintain a programme of training in access and customer care for staff and volunteers
In consideration of the high proportion of visitors from overseas, the Museum provides brief guides in eight foreign languages. However, more could be done to interpret the Museum in the languages of the most frequent visitors: French, German and Japanese.
Education Provision
Since the Museum was founded, it has had a stated educational role. In order to provide quality, diverse and more accessible educational services, the Museum will strive to:
∙ continue to employ an education officer with specific educational qualifications and experience to develop the educational provision of the museum
∙ support in-service training both for the designated education officer and other members of staff in the area of education
∙ participate in partnership arrangements with the local authorities, the universities and extra-mural departments, schools and adult education establishments
∙ generate materials appropriate to the needs of education groups making use of the museum
∙ develop direct contacts with teachers and others working in education, and engage in research both on the market for the service and the potential of the museum for meeting its needs
∙ publicise the education service through all means, including the museum website
∙ seek revenue grant support for specific education and access projects and also capital grant for the education component in the longer term development plan for the museum
∙ set specific targets for the implementation of the strategy together with monitoring and evaluative procedures.
Personnel
The Museum operates within an equal opportunities policy (1999, as an integral part of forward plan) to ensure that no volunteer or member of staff is discriminated against. This policy highlights recruitment and employment practice, which involves reassessment of existing contracts and job descriptions, the recruitment of appropriate personnel and provision of necessary training.
5. RESEARCH METHODOLOGY
The objective of this research project is to investigate whether or not the Cambridge & County Folk Museum has delivered quality service to its external customers. The process and result may also benefit other independent museums of similar backgrounds.
5.1 Questionnaires’ Design
The object of the research project comprises potential audiences, current visitors, staff and receptionist questionnaires. The first two are a measure of service quality from the customers' point of view (Gap 5), thus are based on the SERVQUAL model (Zeithaml et al., 1990), and the others examine Gap 1 to Gap 4 utilising the service-provider gaps model (see chapter 2-5). These instruments are able to generate numerical values for the dimensions of service quality and the strength of the organisation's operation; higher values indicating that service is being delivered more effectively. The result can be compared to a diagnostic checklist and therefore give insight into possible causes of unsatisfactory service. The more detailed method of designing each type of questionnaire is shown in the following.
Potential Audience Questionnaire (see Appendix A)
This questionnaire is designed to obtain general audience expectations of museums' service quality. It contains two parts. Part I includes 17 statements representing audience expectations of an excellent museum. The original SERVQUAL questionnaire (in both the expectations and perceptions sections) has 22 statements which are grouped into five dimensions - tangibles, reliability, responsiveness, assurance and empathy. However, believing some of the questions on suitable for the museums' service and the willingness of respondents to complete the questionnaire, the researcher redesigned part of the statements and reduced the number of them. In addition, the five dimensions in SERVQUAL were returned to the original ten dimensions, in order to gain more detailed information for analysis. Each statement has five ranges: respondents can choose from 'essential' to 'not at all important'.
The way to group the statements into ten dimensions is as follows
Part II concerns information on the respondents' backgrounds. The answers to respondents' occupations are grouped by utilising SOC: Standard Occupational Classification (Office of Population Censuses & Surveys, 1991). The categories and its codes are:
I professional, etc. occupations
II managerial and technical occupations
III(N) skilled occupations (non-manual)
III(M) skilled occupations (manual)
IV partly skilled occupations
V unskilled occupations
The question 'which newspaper do you usually read?' is intended to reveal respondents' education levels. All sorts of newspapers are classified in four levels; they are:
High Brow Level: The Times, Guardian, Independent, Financial Times, Daily Telegraph;
Middle Brow Level: Daily Mail, Express;
Low Brow Level: Sun, Mirror; Cambridge Evening News.
Others: other local newspapers, foreign newspapers or
respondents do not read newspaper.
Current Visitor Questionnaire (see Appendix B)
When designing this questionnaire, the researcher consulted with the curator several times to ensure that the statements involved information which could benefit the Folk Museum, such as which facilities/services visitors wanted the Museum to provide. The final questionnaire contains four parts and is used to investigate the evaluations of the Folk Museum's visitors. The principle of designs for part I to part III is the same as for Part I in the audience questionnaire. However, in order to give more detailed information of visitor perceptions and therefore to benefit the Folk Museum's redevelopment, this questionnaire had more statements related to ten dimensions. Because statements relate to different experiences in the Museum, and not all visitors take part in every experience, the statements are arranged in three parts, each of three
The question numbers pertaining to the dimension are
Part TV is utilised to collect respondents' data. The designing method is the same as Part II in the audience questionnaire. It is combined with other statements for certain investigations.
Staff Questionnaire (see Appendix C and Appendix D)
Quality service relies on an organisation's effective operation and the extent of the understanding of its customers. Both staff and volunteer questionnaires are designed to investigate the Museum's perceptions of its service quality to the public and whether its operation is effective.
The staff questionnaire contains two sections, both used to survey staff responsible for day-to-day management. The first section (Appendix C) examines whether managerial staff understand how users evaluate the Museum's service quality from ten dimensions. The respondents are asked to allocate a total of 100 points among the ten determinations according to how important each determination is to their customers.
The second section (Appendix D) sets nine statements which pertain to potential antecedents of the two managerial gaps (Gap 1 and Gap 2). The specific antecedents and statements on the questionnaire pertaining to them are:
Gap I Marketing research orientation Statements 1-2
Upward communication Statement 3
Management commitment to service Statements 4-5 Gap 2 Goal-setting Statements 6-7
Receptionist Questionnaire (see Appendix E)
This questionnaire contains a set of ten statements that are used to survey receptionists. These statements pertain to potential antecedents of Gap 3 and Gap 4, representing performance shortfalls on the part of receptionists. The specific antecedents and the statements pertaining to them are:
5.2 Process
The research was carried out in June and July 2000. The survey methods and research processes of the four types of questionnaire are outlined in the following.
Potential Audience Questionnaire
In order to obtain detailed information and give the researcher more control over the quality of the respondents' answers, the interview was judged the appropriate method for this questionnaire. The research was undertaken by a street survey on an aimed sample of 100 people, conducted in Cambridge Market (CM), King's Parade (KP), Petty Cury (PC) and Cambridge Central Library (CL). The first three venue surveys were conducted on two Sundays and one bank holiday in the hope to reaching both local and non-local people in different types of groups. However, during research the interviewer found that a high proportion of respondents were non-local people, thus the last venue was chosen to obtain more local respondents.
Questionnaires were administered orally and recorded by the interviewer, encouraging clarity and continuity in style of response. A total of 102 respondents were interviewed; however, two of them did not provide personal information or answer all the questions. Therefore, 100 questionnaires are valid in the final result.
Current Visitor Questionnaire
This research was carried out at the Folk Museum between 19 June and 14 July, mostly on weekdays. There was no focus group; the researcher interviewed all visitors who were willing to answer the questionnaire after completing their visit. The targeted valid number of responses is one hundred. The interviewer led respondents to exhibition Room 1 and emphasised that the interviewer was not on the Folk Museum's staff, in order to obtain more authentic opinions. Although the interviewer attempted to administer and record each questionnaire, a few respondents preferred to complete the questionnaire by themselves. Therefore, some of questionnaires were not totally completed.
The original questionnaire did not involve the box 'other'. However, a number of respondents pointed out they could not evaluate some statements, because they did not use the cloakroom, or the way they found the Museum was 'passed by'; the researcher gathered and recorded these notes as the range of 'other' in the final result.
Although the total respondents were 103, the valid responses in the final result are 100 because in three questionnaires less than half of total statements were answered.
Staff and Volunteer Questionnaire
Both staff and volunteer questionnaires were designed as a 'self-completion' type. Although the researcher did not attend whilst staff and volunteers competed the questionnaires, respondents were given clear instructions on a letter with the questionnaire, and encouraged to write down their opinions. All questionnaires were collected in a box. Staff questionnaires were successfully completed by a total of five staff in the Folk Museum.
The reception duty is taken by staff and five regular volunteers at the present. The researcher did not ask staff to respond to the receptionist questionnaire to avoid staff evaluating themselves in some statements. Therefore, the final result is based on five valid responses.
5.3 Summary of Findings
The results of the four types of questionnaires are exhibited as percentages in the following.
POTENTIAL AUDIENCE QUESTIONNAIRE
Date: 19 June 24.0 20 June 13.0 Time: Place: CM 36.0 KP 17.0
03 July 21.0 04 July 42.0 PC 5.0 CP 42.0
PART I
Directions: How important are the following things for an EXCELLENT MUSEUM? (Not including the subjects of exhibits themselves)
`
10. Museum is as described
on leaflets, guides books…
(as you expected) 16.0 29.0 49.0 6.0 0.0
11.Staff are polite and friendly 30.0 40.0 28.0 2.0 0.0
12.Staff make you feel
welcome 19.0 32.0 42.0 7.0 0.0
13. Staff should know who
you are if you are
regular visitors 3.0 11.0 23.0 53.0 10.0
14. Staff understand visitors'
specific needs (e.g. students
do research; disabled people
special guide for exhibition..) 20.0 29.0 44.0 6.0 1.0
15. Charge correct amount/
give correct change at the first
time in the shop
or admission fee 22.0 30.0 39.0 8.0 1..0
16. Staff have time to answer
your questions 23.0 4.0 28.0 5.0 0.0
17. Staff have enough
knowledge to answer your
questions (about exhibits,
history of this museum...) 35.0 46.0 16..0 3.0 0.0
n=100
PART II
n=100
(1) Gender • Male 34..0 • Female 66.0
(2) Party type • Alone 55.0 • with Children 13.0 • with Adults 32.0
(3) Age • Under 20 13.0 • 21-40 42.0 • 41-60 30.0 • 60+ 15.0
- Where do you live?
• Cambridge 41.0 • Cambridgeshire 16.0
• Rest of UK 28.0 • Outside the UK 15.0
- What is your occupation?
SOC I 9.0 SOC V 2.0
SOC II 33.0 Student 26.0
SOC III(N) 5.0 Unemployed 3.0
SOC III(M) 3.0 Retired 15.0
SOC IV 2.0 Others 2.0
- Which newspaper do you usually read?
High Brow Level: 53.0 Low Brow Level: 11.0
Middle Brow Level: 14.0 Others: 22.0
- Have you been to any museum(s) in past 12 month?
• No 80.0 • Yes 20.0
CURRENT VISITOR QUESTIONNAIRE
Date: 20/June 9.0 21/June 7.0 23/June 5.0 26/June l0.0 27/June 9.0
3/July 6.0 04/July 6.0 05/July 7.0 06/July 3.0 07/July 8.0
10/July 9.0 11/ July 3.0 12/July 9.0 13/July 7.0 14/July 2.0
n=100
Time: Place: Folk Museum
PART I How satisfied are you with the following things in the Folk Museum?
Very Quite Satisfied Not Very Not At Other
Satisfied Satisfied Satisfied All Satisfied
1. Indications of where
to go in the Museum 54.0 27.0 24.0 5.0 0.0 0.0
N=100
2. Labels for objects 44.0 33.3 17.2 5.1 0.0 0.0
N=99
3. Information Boards/ 35.7 34.7 20.4 7.1 0.0 0.0
Interpretation panels
N=98
4. Brief guide 16.0 17.0 14.0 4.0 0.0 49.0
N-100
5. Lights 35.0 35.0 23.0 6.0 1.0 0.0
N=100
6. Display windows 45.5 30.3 20.2 4.0 0.0 0.0
N=99
7. Temporary
exhibition space 38.4 28.3 22.2 7.1 1.0 3.0
N=99
8. Shop 25.3 23.2 37.4 10.1 0.0 4.0
N=99
9. Cloakroom/left
luggage(safe enough?) 16.2 10.1 9.1 4.0 1.0 59.6
N=99
10. Physical
environment (e.g.
steps.. safe enough?) 15.3 29.6 42.9 12.2 0.0 0.0
N=98
11. Opening hours
(convenient to you?) 39.0 34.0 23.0 4.0 0.0 0.0
N=l00
PART II Do you agree the following things in the Folk Museum?
Strongly Quit Agree Disagree Strongly Other
Agree Agree Disagree
12. Is it easy for
you to find this
Museum 43.0 29.0 15.0 4.0 1.0 8.0
N=100
13. Folk Museum is
as described on
leaflets, guide books
(as you expected) 30.5 27.4 14.7 3.2 1.1 23.2
N=95
14. Staff is polite
and friendly 78.8 16.2 5.1 0.0 0.0 N/A
N=99
15. Staff make you
feel welcome 79.0 6.0 5.0 0.0 0.0 N/A
N=100
16. Staff charged
correct amount/give
correct change at the
first time in shop
or admission fees 76.5 16.3 7.1 0.0 0.0 N/A
N=98
PART III How important are the following things for the Folk Museum?
Essential Very Important Not Very Not At All
Important Important Important
17. A free floor plan 11.2 20.4 29.6 34.7 4.1
N=98
18. Computer kiosk
about exhibition 2.1 9.4 13.5 50.0 25.0
N=96
19. CD-ROM guide 3.1 4.1 12.2 51.0 29.6
N=98
20. Audio guide 5.1 20.2 30.3 30.3 14.1
N=99
21. Guided tour 4.0 6.1 25.3 48.5 16.2
N=99
22. Guide books 5.1 16.2 42.4 30.3 6.1
N=99
23. Restaurant/cafe 4.0 4.0 21.0 45.0 26.0
N=l00
24. Meeting /Study room 4.0 5.1 27.3 47.5 16.2
N=99
25. Public toilets 18.0 23.0 34.0 22.0 3.0
N=100
26. Baby care 5.3 10.5 35.8 33.7 14.7
N=95
27. Disabled toilets 12.1 22.2 34.3 21.2 10.1
N=99
28. Public car park 3.1 6.3 15.6 42.7 32.3
N=96
29. Pre-booking for
groups, N=97 14.4 18.6 46.4 19.6 1.0
30. Services to research
or examine people's
objects (e.g. history, 9.1 28.3 44.4 15.2 3.0
antiques...), N=99
31. Library accessible
to all,N=98 7.1 18.4 32.7 34.7 7.1
32. Facilities for
disabled visitors to go
upstairs,N=97 18.6 26.8 37.1 12.4 5.2
33. Complaining/
suggestion boxes or
desk,N=99 2.0 14.1 46.5 27.3 10.1
34. Foreign language
(in guides; labels;
brochure...), N=99 11.1 34.3 35.4 16.2 3.0
35. Website 6.1 15.3 37.8 25.5 15.3
N=98
36. Staff know who
you are if you are
regular visitors,N =98 5.1 12.2 35.7 34.7 12.2
37. Staff understand
visitors particular
needs (e.g. students
do research; disabled
people need special
guide for exhibition..) 13.0 36.0 43.0 7.0 1.0
N=100
38. Staff have time to
answer your questions 16.0 45.0 32.0 6.0 1.0
N=100
39. Staff have enough
knowledge to answer
your questions (about
exhibits/the Museum's
history), N=100 27.0 34.0 37.0 2.0 0.0
40. Value for money? 100% 80-100% 60-80% 40-20% 0-20%
Percentage 55.0 35.0 8.0 1.0 1.0
PART IV
n=100
(1) Gender • Male 38.0 • Female 62.0
(2) Party type • Alone 35.0 • With Children 20.0 • With Adults 45.0
(3) Age • Under 20 9.0 • 21-40 40.0 • 41-60 39.0 • 60+ 12.0
(4) Where do you live?
-
Cambridge 13.0 • Cambridgeshire 18.0
-
Rest of UK 44.0 • Outside the UK 25.0
(5) What is your occupation?
SOC I 11.0 SOC V 1.0
SOC II 26.0 Student 20.0
SOC III(N) 13.0 Unemployed 7.0
SOC III(M) 3.0 Retired 13.0
SOC IV 3.0 Others 3.0
- Which newspaper do you usually read?
-
High Brow Level: 40.0 • Low Brow Level: 9.0
-
Middle Brow Level: 21.0 • Others: 30.0
- Have you been to any museum(s) in past 12 month?
• No 91.0 • Yes 9.0
GOVERNING STAFF QUESTIONNAIRE (TEN DIMENSIONS)
Date: 22, 27 / 06 /2000 Time: Place: Folk Museum
n=5
PHYSICAL ENVIRONMENT 56 points
SECURITY 34 points
ACCESS 48 points
COMMUNICATION 42 points
CREDIBILITY 44 points
COURTESY 64 points
CUSTOMER EMPATHY 62 points
RELIABILITY 56 points
RESPONSIVENESS 43 points
COMPETENCE 51 points
Total Points allocated 500 points
GOVERNING STAFF QUESTIONNAIRE
Date: 22,27/ 06 /2000 Time: Place: Folk Museum
n=5
Strong Quite Agree Disagree Strongly
Agree Agree Disagree
1.We regularly collect information
about the needs of our users (e.g.
what they like/dislike; their
suggestions/complains) 0.0 4.0 1.0 0.0 0.0
2. Marketing research is the main
information that is used to improve
quality of service for visitors 0.0 2.0 3.0 0.0 0.0
3. We frequently ask or listen to the
suggestions from receptionists (inc.
volunteers & staff) 2.0 2.0 1.0 0.0 0.0
4 .Our Museum has regular meetings
to discuss how to improve the quality
of service to users 2.0 1.0 2.0 0.0 0.0
5. We focus on having a relationship
with users rather than the number
of users 0.0 3.0 2.0 0.0 0.0
6.Our Museum has formal, up-to-
date and clear customer care policy 1.0 0.0 3.0 1.0 0
7. Service quality goals are based on
user-oriented standards (from users’
suggestions/opinions...) 1.0 2.0 2.0 0.0 0.0
8. We ask receptionists/staff to
provide basic service quality to users .
(e.g. information about floor plan; be
polite; help users to get answers they
inquired...) 5.0 0.0 0.0 0.0 0.0
9.We have enough resources and
personnel to meet users’
demand/requirements 0.0 1.0 1.0 2.0 1.0
RECEPTIONISTS QUESTIONNAIRE
Date: 21-27/06 /1999 Time: Place: Folk Museum
n=5
Strong Quite Agree Disagree Strongly
Agree Agree Disagree
1.I feel that I am part of a team in the 3.0 1.0 1.0 0.0 0.0
Museum
2.When I need help during working
time, I always can find other staff to
help me 4.0 0.0 1.0 0.0 0.0
3.The Museum gives me enough
training or information to serve
visitors/users (e.g. how to sell
different tickets; what is the basic
information I should tell visitors
when they come in...) 3.0 0.0 2.0 0.0 0.0
4.The Museum provides a
comfortable environment (both
physical and humane), so I am able
to perform the service well 2.0 2.0 1.0 0.0 0.0
5. I am encouraged to tell governing
staff my opinions about improving
the quality of service to visitors/users
(e.g. if we can provide public toilets,
our visitors will feel more satisfied...) 4.0 0.0 1.0 0.0 0.0
6. When the Museum has new
policies about serving visitors/users
I always know immediately 1.0 2.0 1.0 1.0 0.0
7.When too many visitors/users
appear at the same time, I can find
other staff easily to help me 1.0 1.0 3.0 0.0 0.0
8.The Museum's advertising provides
enough and correct information/image
about the Museum to visitors/users 1.0 4.0 0.0 0.0 0.0
9.The visitors I meet rarely complain
that the Museum is not what they
think (as leaflets/ guide books
describe) 5.0 0.0 0.0 0.0 0.0
10. We won't promise to meet the
requirements of visitors/users that
we cannot achieve 2.0 2.0 1.0 0.0 0.0
6. ANALYSIS OF RESEARCH FINDINGS
This chapter contains three sections. The analysis of the four types of questionnaire is divided into two groups in chapter 6.1 and 6.3. Chapter 6.1 contains potential audience and current visitor questionnaires which investigate customers evaluations of service quality (Gap 5). It was analysed by a computer package of Excel.
Chapter 6.2 follows the current visitor questionnaire and focuses on certain statements to investigate various opinions influenced by visitors' different backgrounds. The cross-tabulation system of Statistical Package for the Social Sciences (SPSS) was utilised to analyse these findings.
The final section is to measure service-provider (Folk Museum) gaps (Caps 1-4) and their causes utilising staff questionnaires and the receptionist questionnaire. The results are quantified by a computer package of Excel.
6.1 Service Quality in the Folk Museum
The method of assessing service quality is not the same as the original SERVQUAL model, because the statements and the sample of the respondents' backgrounds in these two types of questionnaires are not the same, nor are the number of responses to each statement in current visitor questionnaires.
The final results are separately illustrated as average points and compared to each other in the end.
Potential Audience Questionnaire
Assessing the expectations of service quality involves computing the rating respondents assign to each statement. The point for each rating is:
Essential =5
Very Important =4
Important =3
Not Very Important =2
Not At All Important = 1
The importance of each dimension of audience expectations of service quality is obtained through the following two steps:
1. computing total points of five ratings on each statement and divided by the numbers of respondents;
2. adding the average points (obtained in step 1) of the statement(s) pertaining to each dimension, and dividing by the number of statements.
As the result Figure 6-1 illustrates that each dimension plays nearly equally important roles in audience expectations of museums' service quality. 'Competence', 'Courtesy' and 'Responsiveness are the three highest determinants of a museum’s service quality, and all of them relate to the element of personnel. In contrast, 'Customer Empathy', the other determinant relating to personnel, plays the least important role whilst respondents evaluate service quality. Among three statements in 'Customer Empathy', over half (53%, see chapter 5.3) of respondents rated the statement of 'staff should recognise regular visitors' as 'not very important'.
Figure 6-1 Audience Expectations of Museums Service
4.1
Average 4.5 3.8 3.8 4.0 3.9
Points 4.0 3.6 3.7 3.6 3.6
3.5 3.2
3.0
2.5
2.0
1.5
1.0
0.5
0.0
Physical Security Access Commu- Credibility Courtesy Customer Relia- Respon- Compe-
Environment nication Empathy bility siveness tence
Dimensions
Current Visitor Questionnaire
The importance of each dimension of visitor perceptions of service quality is also obtained through the two steps mentioned above. However, the computing points of statements 'in this questionnaire are different. All statements can be divided into three computing groups. The statements in each group and their computing points are as following.
Group A S1-S1 6. Visitors encountered these statements in the Museum and were able to evaluate the outcomes:
Very Satisfied / Strongly Agree =5
Quite Satisfied/Quite Agree =4
Satisfied / Agree =3
Not Very Satisfied / Disagree =9
Not At All Satisfied / Strongly Disagree =1
Group B S17-S28, S30-S35. The Museum does not provide these services or facilities. The more important respondents thought them, the less satisfied the respondents were that the Museum does not provide these items.
Essential =1
Very Important =2
Important =3
Not Very Important =4
Not At All Important =5
Group C S29, S36-539. The respondents usually were not able to evaluate these
statements which the Museum may provide, because they did not encounter them on their visit. The result of this group is illustrated separately.
Essential =5
Very Important =4
Important =3
Not Very Important =2
Not At All Important =1
The result of each average point in ten dimensions is shown in Figure 6-2 (below). Among the ten dimensions, 'Responsiveness' and 'Competence' are based on the
question 'how important it is for the Folk Museum', because there is only one statement in each dimension. In addition, the outcomes of statements 29, 36 to 37 are illustrated separately, because the nature of the question is different from others.
It is clear that the best of the Folk Museum's performances are in 'Courtesy', 'Customer Empathy' and 'Reliability'. All these three dimensions are related to receptionists' performance. In addition, the respondents also gave quite a high assessment in 'Credibility' which shows the Folk Museum communicates to public through trustworthy information.
Figure 6-2 Visitor Perceptions of The Folk Museum's Service
4.7 4.7 4.7
5.0 4.1 3.9
Average 4.5
Points 4.0 3.7 3.7 3.5 3.7 3.7
3.5
3.0
2.5
2.0
1.5
1.0
0.5
0.0
Physical Security Access Commu- Credibility Courtesy Customer Relia- Respon- Compe-
Environment nication Empathy bility siveness tence
Dimensions
Dimension Statement Number(s) Average Points
Access S29 3.3
Customer Empathy S36-S37 3.1
'Access' is the dimension with which respondent visitors were less satisfied. Although over 70% of respondents described themselves as 'very satisfied' or 'quite satisfied' to the statement 'opening hours', many respondents think it is important for the Folk Museum to provide disabled access to upstairs (37.1% described it as 'important', around 45% as 'essential' and 'very important').
Moreover the respondents thought staff having time and knowledge to answer their questions (Responsiveness and Competence) is more important than that staff should recognise regular visitors and understand their particular needs (Customer Empathy).
6.2 More Analysis from the Current Visitor Questionnaire
This part investigates the demand of visitors from particular backgrounds for some facilities or services that the Folk Museum does not provide at present. The analysis targets four questions and is illustrated with cross-tabulate of SPSS.
Different Party Types versus the Demand of Restaurant/Cafe, Toilets, and Car Park
Restaurant/cafe Alone With Family With Adults
Essential 1.0% 1.0% 2.0%
Very important 1.0% 1.0% 2.0%
Important 8.0% 6.0% 7.0%
Not very important 16.0% 8.0% 21.0%
Not at all important 9.0% 4.0% 13.0%
Most respondents did not think a restaurant/cafe was important to their visit, no matter which party types they belonged to. Many of them said a museum providing catering facility is good, but not for the Folk Museum due to its small size and limited space.
Public toilets Alone With Family With Adults
Essential 3.0% 6.0% 9.0%
Very important 10.0% 7.0% 6.0%
Important 16.0% 6.0% 12.0%
Not very important 6.0% 1.0% 15.0%
Not at all important 0.0% 0.0% 3.0%
Comparing each type of group with the five extents on statements, 13 out of 20 respondents attending with family described 'public toilets' as 'essential' and 'very important' to their visits. In contrast, respondents with adults tended to have less demand. However, over 40% of total respondents said public toilets are an essential' and 'very importantt facility that the Museum should provide.
Public car park Alone With Family With Adults
Essential 1.0% 1.0% 1.0%
Very important 0.0% 1.0% 5.2%
Important 6.3% 4.2% 5.2%
Not very important 15.6% 3.1% 24.0%
Not at all important 11.5% 11.5% 9.4%
These figures show that a ‘public car park’ is not an important factor in influencing visitor perceptions of the Folk Museum's service. When the interviewer asked this statement, some respondents pointed out that they could use public transport or park their cars in other car parks nearby; many others said parking space is not necessary for this size of museum.
Types of Newspapers versus the Demand of Computer Kiosk, CD-ROM and Website
Computer kiosk High brow Middle brow Low brow Other
level level level
Essential 1.1% 0.0% 0.0% 0.0%
Ver important 1.1% 5.4% 1.1% 2.2%
Important 4.3% 3.2% 1.1% 4.3%
Not very important 22.6% 10.8% 6.5% 11.8%
Not at all important 11.8% 1.1% 2.2% 9.7%
Only a low proportion of respondents described a 'computer kiosk' as 'essential' or 'very important' facility that the Museum should provide; even 'higher educated respondents' said so. Some respondents said they preferred to see 'real things', or that a computer kiosk is not suitable for history museums.
CD-ROM High brow Middle brow Low brow Other
level level level
Essential 2.1% 0.0% 0.0% 0.0%
Very important 0.0% 2.1% 1.1% 1.1%
Important 2.1% 6.3% 0.0% 4.2%
Not very important 22.1% 10.5% 7.4% 11.6%
Not at all important 14.7% 2.1% 2.1% 0.5%
The result is similar as that for a 'computer kiosk'. Most respondents thought that they are not disappointed if the Museum does not have CD-ROM.
Website High brow Middle brow Low brow Other
level level level
Essential 2.1% 1.1% 1.1% 1.1%
Very important 5.3% 6.3% 0.0% 4.2%
Important 14.7% 9.5% 4.2% 9.5%
Not very important 10.5% 3.2% 4.2% 8.4%
Not at all important 7,4% 2.1% 1.1% 4.2%
Comparing the results of 'computer kiosk' and 'CD-ROM', more respondents described a 'Website' as 'essential' or 'very important' technology to obtain information about the Folk museum. These three results illustrate that if the Museum is considering providing high-tech facilities to their users, a 'Website' is the priority.
Ages versus Value for Money
Value for money? Under 20 21-40 41-60 61+
0-25% 0.0% 0.0% 1.0% 0.0%
25-50% 0.0% 0.0% 1.0% 0.0%
50-75% 1.0% 6.0% 1.0% 0.0%
75-100% 4.0% 13.0% 16.0% 2.0%
100% 4.0% 21.0% 20.0% 10.0%
Over half of total respondents thought a visit to the Folk Museum was 100% value for money. In other words, the other half of respondents had contrary opinions, and this may be due to respondents thinking the admission charges were too high or they were not very satisfied with some parts of their visit. Visitors aged 21-40 contain the highest proportion of responses of '50% to 75%' (6 out of 40 respondents).
Where do Visitors Live? versus the Demand of Foreign Language
Foreign languages Cambridge Cambridgeshire UK Outside of the UK
Essential 1.0% 1.0% 5.1% 4.0%
Very important 5.1% 4.0% 18.2% 7.1%
Important 3.0% 12.1% 15.2% 5.1%
Not very important 1.0% 1.0% 5.1% 9.1%
Not at all important 3.0% 0.0% 0.0% 0.0%
Around 45% of respondents said it was essential or very important that the Museum provides foreign languages information. It should be pointed that over{ half of the respondents who lived in other areas of the UK (23 out of 43 respondents) regarded foreign languages as an essential or very important facility in the Museum; this proportion is higher than overseas group or the groups from Cambridge and Cambridgeshire.
6.3 Measuring Staff Questionnaire (Ten Dimension)
This section contains three questionnaires: staff questionnaire (ten dimensions), staff questionnaire (Gaps 1-2) and receptionist questionnaire (Gaps 3-4).
Governing Staff Questionnaire (Ten Dimensions)
This part of the research is to identify whether staff understand how audiences and visitors evaluate the Folk Museum's service. The five respondents were asked to allocate a total of 100 points among the ten dimensions according to the importance of each dimension. The result is obtained from three steps:
1. computing the total points of each dimension;
2. adding all points of ten dimensions;
3. total points of each dimension (step 1) divided by all points of ten dimensions (step 2), the result giving as a percentage
Comparing this result with the results of audience and visitor questionnaires transformed to percentages, the outcomes are as follows.
Firstly, except from 'Security' and a small range of 'Physical Environment', the results from the governing staff and current visitors are similar. This may be due to
the contribution of the Museum's twice a year visitor survey. However, potential
audiences pay more attention to 'Security', 'Communication' and 'Responsiveness' than staff conjectured.
Governing Staff Questionnaire (Gap l and Gap 2)
Governing staff and receptionist questionnaires were designed to investigate the condition of the Folk Museum's internal operation. The computing points of five ratings in each statement on both the staff and the receptionist questionnaires are
Strongly Agree =5
Quite Agree =4
Agree =3
Disagree =2
Strongly Disagree =1
The average points along each dimension is obtained through adding all points of each statement and dividing by the number of respondents. The specific antecedents and their corresponding statements of each Gap are mentioned in chapter 5.3.
As Figure 6-3 shows, each bar of dimension contains 'current status' and 'opportunity for Gap closure'. The higher the point of 'current status', the more effective the Museum's internal operation is.
Gap 1 Gap 2
0.0
5 0.8 5 1.0
4 4 1.8
3 3
2 2 4.0
1 1 3.2
0 0
S1 S2 S3 S4 S5 S6 S7 S8 S9
Blue No: Current Status Black No: Opportunity for Gap Closure
Figure 6-3 Managerial Gaps (Gaps I and 2)
Gap 1 represents 'not knowing what customers expect'. Figure 6-3 shows there is no big gap in 'upward communication' (S3), this may due to the Museum not having
large numbers of staff or volunteers and sometimes staff need to take over reception. Statements 1 and 2 illustrate that the Museum still needs to do more in researching users expectations to close Gap 1.
Statements 4 to 9 pertain to potential antecedents of Gap 2 which represents 'the wrong service-quality standards'. The bar of statement 9 shows that the Folk Museum does not have enough resources and personnel to meet users' demands or requirements. The lack of personnel and resources is a challenge for the Museum's redevelopment. The result of statement 8 is impressive; all staff strongly agreed they ask receptionists to provide basic service quality to users. This can explain why visitors were more satisfied with the 'animate environment' (people) in the Folk Museum.
Receptionist Questionnaire (Gap 3 and Gap 4)
The method of computing this questionnaire is the same as the staff questionnaire. The Gap 3 is ' the service performance gap', the difference between service specifications and actual service delivery. The statements in this Gap relate to the potential antecedents of whether receptionists are able and/or willing to perform the service at the desired level. Figure 6-4 illustrates that the Governing staff need to reinforce aspects to the receptionist's role: (i) when the Museum has new policies about serving visitors/users, it should clearly informs staff/volunteers who have contact with visitors/users in lime; (ii) there should be an easier system or facility for receptionists to find help from other staff when many visitors attend at the same time.
Gap 3 Gap 4
0.6 0.4 0.6 0.0
5 0.8 0.8 5 0.8 0.8
4 1.4 1.4 4
3 3 5.0
2 4.4 4.6 4.2 4.2 4.4 2 4.2 4.2
1 3.6 3.6 1
0 0
S1 S2 S3 S4 S5 S6 S7 S8 S9 S10
Figure 6-4 Receptionists (Gaps 3 and 4)
The fourth major cause of low service-quality perceptions is Gap 4, when promises do not match delivery. Receptionists are the first people who have contact with visitors and obtain an information about visitor satisfactions or dislikes. The bars of statements 8 to 10 reflect that from the receptionists' point of view, the Museum provides credible information when communicating with the public, and does not overpromise its service to its visitors/users.
7. CONCLUSION
The Cambridge & County Folk Museum, like other independent museums, faces decreasing numbers of visitors and increasing competition from both the museum and other leisure sectors. As the Museum has entered the new millennium and prepares its redevelopment, it is necessary to review the quality of service the Museum provides.
The aim of this study is to investigate whether or not the Museum delivers quality service to external customers by means of conducting surveys of audiences, visitors and staff.
As the outcomes of the potential audience and current visitor questionnaires illustrate, visitor assessment of the Museum's service quality is generally higher than audience expectations in most determinants of service quality, especially in the dimensions which relate the performance of staff/volunteers who have contact with visitors.
However, visitor assessments in 'Physical Environment' and 'Access' do not exceed audience expectations. When the causes are investigated, several results are obtained:
1. compared with other facilities, visitors indicated that public/disabled toilets, a free floor plan and an audio guide are the most important things the Museum should provide
2. visitors are less satisfied with interpretation panels (average point: 4.0) and brief guides (3.9); however audiences very much emphasised the importance of explanation of exhibits (4.3)
3. nearly half the respondent visitors appraised 'shop' as 'satisfied' and 'not very satisfied'; compared with other statements which asked 'how satisfied they are', this is a low assessment
4. although visitors comprehend that the Museum is located in a historic building and has difficulty in providing facilities for disabled visitors accessing upper floors, around 45% of them chose these things as 'essential' and 'very important'.
When visitors evaluated the experiences of their visit in the Museum, some respondent visitors were more tolerant of certain determinants of service quality, due to the Museum's size and physical environment (a historic building). Many respondents prefer a museum to provide a cafe or restaurant, but said it is not necessary for museums of this size. Although the stairs were not safe for some respondents, they did not suggest the Museum rebuilds them, because of the building listed status.
Moreover, the way visitors responded to 'Responsiveness' and 'Competence' are less important than the way outside audiences responded. This may be due to (i) most visitors believe staff have enough knowledge and always have time to answer their questions if they ask; (ii) they prefer finding answers by themselves; (iii) they accept the limited staff numbers in the Museum; (iv) the collections are related to the objects of daily life, so some visitors have knowledge about exhibits before their visit.
When the demands for facilities and services that the Museum does not provide are combined with respondent visitors' backgrounds, the following findings were obtained:
1. not many respondents in all three party types regarded a restaurant/cafe and public car park as important facilities the Museum should provide
2. public toilets are more important for family groups
3. the educational element does not have much influence on the demand for high-tech: most respondents described a computer kiosk and CD-ROM as 'not very important' and 'not at all important'
4. compared with a computer kiosk and CD-ROM, a Website is the most popular from the answers of 'essential', 'very important' and 'important
5. over half the respondents from all age groups assessed their visits were 100% value for money
6. a higher proportion of respondents aged 21-40 considered their visit less than
100% value for money than other groups
7. more visitors from other regions in the UK regarded 'foreign languages' as essential and very important.
The results of the staff questionnaire (ten dimensions) show that governing staff understand how visitors evaluate service quality in the Museum due to the contribution of the twice 'yearly visitor survey. However, potential audiences emphasise more the importance of 'Security', 'Communication', 'Responsiveness' and 'Competence'.
The biggest gap in internal staff questionnaires is that the Museum does not have enough resources and personnel to meet users' requirements. The shortcomings may
cause the Folk Museum to spend more time on its redevelopment, perhaps reinterpreting collections and the building, or apply for funding to support many projects. In addition, as the result shows in Figure 6-3 (in the former chapter), a formal, up-to-date and clear customer care policy is required when the Museum sets service quality goals which are based on customer standards and expectations.
The outcome of the receptionist questionnaire shows that the volunteers who have contact with visitors and users are not informed immediately when the Museum has new policies about serving external customers. The Museum needs to improve communication with receptionists about information related to policies for serving customers.
Taken as a whole, the outcomes of this research project reflect that there is no serious gap in the processes of delivering service; the Folk Museum provides good quality service to its visitors. The reasons for the decline of visitor numbers may stem from the overall increasing competition in the leisure sector, the shorter leisure time audiences have, or through not enough communication to the public to give them attractive images of the Museum, such as suggesting it is a place where they can spend time with friends and family, have fun, find interesting... etc.
Although a high proportion of visitors attended the Museum because of word-ofmouth, the Folk Museum needs to do more about creating other attractive methods of communication and promotion with public.
8. RECOMMENDATIONS
Gap 5
1. In order to provide a better physical environment for users, the following facilities need to improve: labels for objects (renew, up-date and bigger print); the shop (more items and better display); indications of directions (or provide a floor plan).
2. Many visitors were attracted by temporary exhibitions, more objects and interpretation relating to them can balance the difference of objects' quantity against other exhibition rooms and increase visitor satisfaction.
3. At least a public toilet is necessary; however, considering the limited space in the Museum at the present, direction from signpost to the staff toilet may be needed as some visitors do not ask when they are in need.
4. Although many respondents do not wish the Museum to rebuild the stairs for the purpose of 'security', they need improving. Brighter lights and warning marks should be considered.
5. Providing facilities for disabled visitors to access upper floors requires a change in the historic building's framework which visitors are not willing to see; however, it is required. Creating other accessible methods, such as using photos of exhibits with tapes introduction, CD-ROM, exhibiting some objects related to exhibits on upper floors, are necessary.
6. Information in foreign languages contributes to the quality of visitors' museum experiences; thus it is worth while using the languages of the Museum's most frequent visitors in brochures, leaflets and labels for long-term development.
7. Using high-tech is also the trend of the museum sector in the future. Websites can not only enable people to get much better access to museums' services, but benefit museums by promoting their reputation.
8. Reinforcing external communications and emphasising the merits of the Museum to audiences can help form positive and attractive images of the Folk Museum, such as a place where they can spend time with friends, have fun.
Gaps 1-2
9. Regular research of local and target potential audiences' needs and expectations is needed to achieve the aim of the Museum of attracting more local visitors and teenagers.
10. Setting customer care policy can help the Museum to ensure delivering at least minimum service quality to users.
11. Seeking more volunteers to share the tasks and projects of redevelopment is the way to create human research without increasing the financial burden.
Gaps 3-4
12. More training and information for receptionists to serve visitors is required, such as selling different kinds of tickets. At the present, the Museum has several discounts for visitors (e.g. Cambridge City Leisure Card holders, Guide Friday Bus Tours) using the same tickets for ‘Adults’, ‘Concessions’ and ‘Children’, clear information on how to charge and which ticket to give can help receptionists deliver a deliver service to visitors.
13. Whilst the Museum has new policies about serving users, it is essential to ensure every receptionist knows them before they serve users.
Service Quality in Museums, a Case Study: Cambridge & County Folk Museum
Eleutheria Kendristaki
The book, Creative Arts Marketing (Hill, O'Sullivan and O'Sullivan, 1998:112), uses 'Participants' instead of 'people' in the three new marketing-mix.
The stakeholders of the museum are subscribers known as Friends of the Cambridge and County Museum and the local authorities. The Friends, about 100 individuals, provide an important source of revenue, a network of contacts within Cambridge and its area and direct voluntary help. The following bodies have the right to nominate ordinary members of the Company: Cambridge City Council (2); South Cambridgeshire District Council (2); Cambridgeshire County Council (1); University of Cambridge (I). The Council of Management consists of the six nominated members of the above bodies and eight elected members of the Friends (including the Chairman and Honorary Secretary). Five members of the Council of Management form an executive Committee. Cambridge City Council nominees have chosen to have observer status only. (Hawke-Smith, 1999:8)
The Folk Museum does not have public toilets; however; it is possible for visitors to use staff toilet.
This section is based on Hawke-Smith, C. (1999) Cambridge & County Folk Museum forward Plan 1999-2004: Crossing the Threshold.
The respondents who chose the answer of 'other', did not use the services/facilities or buy a brief guide, thus they were unable to evaluate these statements.
The answers of ‘others’ in Statements 12-13 include ‘passed by’, ‘tour bus’, ‘knew before’, ‘been the Museum before’…etc. Therefore, the respondents could neither agree or disagree.
The SERVQUAL Gap scores are computed as: SERVQUAL Score=Perception Score-Expectation Score
While this research was carried out, the Museum did not have a telephone extension system; thus it was difficult to find help from back of office. However, this problem