During the investigation I did a census of the shops in each area, I did a pedestrian count, counting people going both in and out of the area. I also did an environmental quality survey at the top and bottom of each area.
I will take lots of photos while I am there. I will use both primary and secondary data and I believe that it will be quite easy to get reliable data. I will start at one end of the city and walk through making notes as I go.
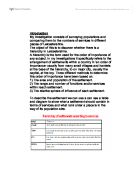
To do my pedestrian count I will make a table before I leave which looks like this:
I will then do a tally of people coming in and out.
My environmental survey will have 5 different factors and will look like this:
e.g. litter
No Litter 1 2 3 4 5 Litter
I will then circle whichever I feel is best for the area
For the information about my shops I will write down on a piece of paper the name of every shop, what it sells and whether it is a chain store or an independently owned shop. When I get back I will do a table which looks like the one below for each area:
While I am there I will take lots of photos of the area.
Analysing, evaluating and interpreting the data
Chi Squared test
AxP – 473 x 456 ÷ 822 = 262.3941606 = 262.39
AxQ – 473 x 366 ÷ 822 = 210.6058394 = 210.61
BxP – 138 x 465 ÷ 822 = 78.06569343 = 78.07
BxQ – 138 x 366 ÷ 822 = 61.44525547 = 61.45
CxP – 211 x 456 ÷ 822 = 117.0510949 = 117.05
CxQ – 211 x 366 ÷ 822 = 93.948990511 = 93.95
Degrees of freedom =
(number rows – 1) x (number columns – 1)
(2-1) x (3-1) = 1 x 2 = 2 degrees of freedom
Df 0.10 0.05 0.01 0.001
2 4.60 5.99 9.21 13.82
My total of 85.61 is outside my degrees of freedom. This means I will reject the null hypothesis and accept the alternative hypothesis that there is an association between the ownership of retail outlets and the type of settlement.
Clone town test
5 points for each type of shop counted, 22 x 5 = 110
50 points for each independent shop, 100 x 5 = 5000
5 points for each chain store = 111 x 5 = 555
110 + 5000 + 555 = 5665 / ÷ 211 (total shops)
= 26.84834123
= 26.85
Using the clone town rating, this makes Lincoln a clone to border town.
Lincoln has a relatively large threshhold population which makes it a good area for chain stores to get a lot of custom.
I also had quite a big pedestrian count which means that there are more likely to be big chain stores due to the amount of people in the town.
This graph shows the amount of people entering and exiting each area between 12:00 and 12:10. There are the same amount of people coming in and out of the Newport Arch – The Strait area, however, in the St Marks area there are more people coming in than leaving. There are also more people entering than exiting the Clasketgate – St Marys area and this area experiences the highest amount of pedestrians. The Strait – Clasketgate experiences the lowest amount of pedestrians with more people leaving than entering.
This graph shows the total number of shops in each area and compares the number of individually
owned shops with the chain stores. From the graph we can see that Clasketgate – St Marys has
many more chain stores than individual stores that chain stores, whereas Newport Arch – The Strait
has many more independently owned stores than chain stores.
This table shows the different types of shops and whether they are independently owned or chain
stores. We can see that clothing and other have the most shops. Other has a wider gap with 30
independently owned and 18 chain, however, clothing has a much smaller gap with 20 independent
and 27 chain. There are much fewer of the shops such as electronics/IT and travel agents. There is
also a difference in gaps with travel agents having 1 independent and 1 chain, however,
electronics/IT has 0 independent and 8 chain.
Presenting a summary
In this investigation I found out that Lincoln is a clone to border town. A clone town is a town where the high street or other major shopping areas are significantly dominated by chain stores.
I also found, by using the chi squared test, that there is an association in Lincoln between the ownership of retail outlets and the type of settlement.
If I was doing this investigation again I might expand it by looking for clusters of chain stores in certain areas and doing a nearest neighbour experiment. I might also look at a larger area and split in into more areas. I would also be more careful with the choices of whether it is a chain store as people have different opinions on what can be classed as a chain store and how many there have to be of the shop before it stops being independent.
Overall I think this investigation went rather well and I was happy with my results.
Bibliography
While doing this investigation I used some secondary data from:
- Methods of statistical analysis of fieldwork data published by the GA by Peter St John and Dave Richardson
This is the high street when stood near St Marys