Microclimates.My purpose of this study is to establish whether my hypotheses are true or not. The following show the list of my hypotheses: 1) The temperature of air is higher in an area of low building density than in an area of low building dens
Microclimates
Aim
My purpose of this study is to establish whether my hypotheses are true or not. The following show the list of my hypotheses:
) The temperature of air is higher in an area of low building density than in an area of low building density.
2) The relative humidity of air is greater in an area of low building density than in area of high building density.
3) When the temperature in a particular area increases the relative humidity decreases providing the water in the air stays the same whether in an area of high building density or low building density.
4) Buildings affect the wind speed in a particular area. The wind speed is high in an area of low building density and is lower in an area of high building density.
5) I expect the cloud cover to be higher, on average, in area with low building density then an area with building density.
The data, which is necessary to collect to see if my hypothesis is correct or wrong are:
) The temperature of air
2) The relative humidity
3) The wind direction
4) The wind speed
5) The cloud cover
I intend to collect this data from two different areas, one area of a surrounding with high building density and an area surrounded with low building density. I recorded the data on a table at hourly intervals for a series of 24 hours. I used this method so that I could compare my results in order to prove my hypotheses right or wrong. I collected the records for 24 hours so that I could compare the readings during the day and night. This investigation took place on 29th August 2002. I utilised various apparatus to measure the data; for example I used a whirling hygrometer to measure the temperature and relative humidity of the air.
Backgrounds Knowledge
Microclimatology is the study of climate over a small area. It includes changes resulting from the construction of large urban centres as well as those existing naturally between different types of land surface. Local climates describe those climates, which have influence over very small geographical areas, perhaps only a few miles or tens of miles across. Under certain conditions local climatic effects may predominate the more general pattern of regional or latitudinal climate. Examples of local climates include land and sea breezes, the orographic effects of mountains and heat island effects of cities.
The development of the sea breeze mimics on a much smaller scale the circulation cells of rising and descending air that make up the Earth's general circulation. On a warm summer's day at the coast, the land heats up faster than the adjoining sea, and the warm surface air rises. Cooler air offshore is drawn in to replace the rising air inland, and a cool sea breeze develops. Usually, the effects of the sea breeze can be felt over only a few miles, but occasionally the air blows inland much further. At night, the land cools down quickly radiating heat to the atmosphere, whilst the sea remains relatively warmer. Under these conditions the sea breeze may reverse to form a land breeze. The presence of mountains can significantly influence the local climate. Mountains force air to rise, and consequently assist the development of clouds and precipitation. It is not uncommon for rain to be falling at the top of a mountain; whilst further downwind it may be dry and even sunny in the rain shadow. Cities contains a lot of concrete structures like streets and buildings, which soak up sunlight during the day. At night, they release this heat, which warms urban areas several degrees Celsius above nearby rural areas. This phenomenon is known as the urban heat island effect. The climate in and around cities and other built up areas is altered in part due to modifications humans make to the surface of the Earth during urbanization.
The surface is typically rougher and often drier in cities, as naturally vegetated surfaces are replaced by buildings and paved streets. Buildings along streets form urban street "canyons" that cause the urban surface to take on a distinctly three-dimensional character. These changes affect the absorption of solar radiation; the surface temperature, evaporation rates, storage of heat and the turbulence and wind climates of cities and can drastically alter the conditions of the near-surface atmosphere. Human activities in cities also produce emissions of heat, water vapour and pollutants that directly impact the temperature, humidity, visibility and air quality in the atmosphere above cities. On slightly larger scales, urbanization can also lead to changes in precipitation above and downwind of urban areas. In fact, urbanization alters just about every element of climate and weather in the atmosphere above the city, and sometimes downwind of the city. Urban areas generate more dust and condensation nuclei due to their industrial nature; they create heat, alter the chemical composition and the moisture content of the surrounding air. They also affect the albedo and the flow of air in the urban area. It is for these reasons that urban areas have their own distinctive climates. Urban areas also tend to have high thermal capacities, this is due to their surfaces being non-reflective and thus absorbs heat in the daytime, they are said to have high albedo rates. Some examples of materials with high thermal capacities that can be found in built-up areas are tarmac, brick walls, concrete and coloured roofs. Heat is also obtained from car fumes, industry, central heating and people themselves. It is for these reasons that such areas are known as URBAN HEAT ISLANDS.
Generally temperatures peak at night in urban areas, this is because dust and cloud act as a blanket to reduce radiation, in addition, buildings emit most of their stored up heat at night. The further away from urbanised areas temperatures decrease and reach a minimum in the countryside. The urban heat island concept explains why cities usually experience less snow, frost and fog than surrounding counterparts, and plants tend to bud and flower earlier in cities due to an increase in temperature. The amount of sunlight, wind velocity, relative humidity, cloud, precipitation and atmospheric composition also differ in ...
This is a preview of the whole essay
Generally temperatures peak at night in urban areas, this is because dust and cloud act as a blanket to reduce radiation, in addition, buildings emit most of their stored up heat at night. The further away from urbanised areas temperatures decrease and reach a minimum in the countryside. The urban heat island concept explains why cities usually experience less snow, frost and fog than surrounding counterparts, and plants tend to bud and flower earlier in cities due to an increase in temperature. The amount of sunlight, wind velocity, relative humidity, cloud, precipitation and atmospheric composition also differ in urban heat islands. Cities receive less sunlight than their rural counterparts since dust and other particles absorb and reflect insulation. High-rise buildings tend to block out sunlight also. Wind velocity is also reduced because buildings create friction and act as wind breakers. However, air can be channelled between buildings and high velocity canyons formed - this is known as THE VENTURI EFFECT. Relative humidity is lower in urban areas since warmer air can hold more moisture also a lack of vegetation and water surfaces limit the process of evapotranspiration. Urban areas experience both more and thicker cloud due to an increase in condensation nuclei; also convection currents are generated by higher temperatures. It is for these reasons also that urban areas recieve more precipitation. With regard to the atmospheric composition of the surrounding air in the urban area, there may be 3 to 7 times more dust particles than in rural areas. These particles are emitted through the burning of fossil fuels, industrial processes and from car exhausts. Urban areas may also contain up to 200 times more sulphur dioxide, and 10 times more nitrogen oxide, (acid rain) 10 times more hydrogen carbonates and twice as much carbon dioxide. For these reasons urban air tends to be polluted and often smog is formed.
Diagram One: Solar reflectivity of different materials used in the urban environment
Diagram Two: showing the range of temperatures across an urban heat island transect
Although cities themselves form a very small fraction of the Earth's surface area, the world's population has become increasingly urbanized and is now affected by urban climates. Cities too, are important sites for greenhouse gas emissions because of the high-energy demands by urban residents and activities. These emissions extend the (indirect) influence of cities on climate to much larger scales. Locally altered urban climates that have existed for many years may provide us with some insight into how to respond to large-scale climate change and this makes the study of urban climates increasingly important.
Urban Heat Island
It has been known for some time that cities are generally warmer than the surrounding, more rural areas. Because of this relative warmth, a city may be referred to as an urban heat island. The reason the city is warmer than the country comes down to a difference between the energy gains and losses of each region. There are a number of factors that contribute to the relative warmth of cities:
* During the day in rural areas, the solar energy absorbed near the ground evaporates water from the vegetation and soil. Thus, while there is a net solar energy gain, this is compensated to some degree by evaporative cooling. In cities, where there is less vegetation, the buildings, streets and sidewalks absorb the majority of solar energy input.
* Because the city has less water, runoff is greater in the cities because the pavements are largely nonporous (except by the pot holes). Thus, evaporative cooling is less, which contributes to the higher air temperatures.
* Waste heat from city buildings, cars and trains is another factor contributing to the warm cities. Heat generated by these objects eventually makes its way into the atmosphere. This heat contribution can be as much as one-third of that received from solar energy.
* The thermal properties of buildings add heat to the air by conduction. Tar, asphalt, brick and concrete are better conductors of heat than the vegetation of the rural area.
* The canyon structure that tall buildings create enhances the warming. During the day, solar energy is trapped by multiple reflections off the buildings while the infrared heat losses are reduced by absorption.
* The urban heat island effects can also be reduced by weather phenomena. The temperature difference between the city and surrounding areas is also a function of the synoptic scale winds. Strong winds reduce the temperature contrast by mixing together the city and rural air.
* The urban heat island may also increase cloudiness and precipitation in the city, as a thermal circulation sets up between the city and surrounding region.
Thermal Circulation: A local or regional circulation system that develops due to pressure gradients created by differences in surface heating.
Areas
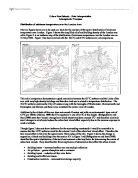
The two areas that is shall be investigating is first West Ealing, an area with high building density, and Osterley Park, an area of low building density. As you can see from photograph of West Ealing High Street, which you can see in Appendix 1, you can straightaway notice the fact this area is of a commercial nature, as there is an array of shops and people walking around in number in the streets. The second factor to be noticed is the fact that there are a number of high rised buildings that seem to be in a concentrated position. If you look at photograph two of Norwood Road, which is situated in West Ealing, you can see the narrow the road is and how there is a high concentration of cars on either side of the road. The dark texture of the houses is very noticeable, also if can see from the map below you can see the sheer concentration of buildings in the surrounding areas, and the great number of roads and motorways.
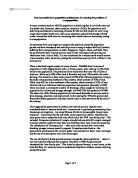
My second area Is Osterley Park, which is an area of low density, as you can see from the two photographs, which can be seen in Appendix 2, Osterley Park, is an area of the description sparse. There are no buildings cluttered together and no high concentration of cars, but great number of forestry and green plants. From the map of Osterley below you can see the sheer sparseness of the area, as you can see there are hardly any motorways or major roads visible.
These descriptions are essential in my prediction work, as there are number of factors that will affect an urban climate. This investigation is extremely relevant in real life situations, as it tells us a lot about climate in rural and urban areas. From this we can forecast weather for the present and future, and also investigate the climate dangers, as urban areas temperatures carry on to rise, the fatal sun rays can cause skin cancer. In order to prevent this we have to understand the reasons behind the rise in temperatures.
What I Expect and Why
I expect a majority of my hypothesis to be true. I expect the first part of my hypothesis to be correct because in rural areas, which are areas of low business density, there is not a lot of heat being given off in to the atmosphere due to there being fewer cars and houses than an urban area. There are also a lot of plants in rural areas, such as West Ealing and plants take in a lot of heat from the atmosphere in the form of sunlight; especially, the tall plants such as trees.
In urban areas, which have high building density, there are lot more cars and surrounding houses. Cars give off huge amounts of heat through the engine and the exhaust pipes and houses give out heat through windows and doors as well as through the roof. Vast amounts of pollution are exposed to the atmosphere from factories. The smoke, from the factories, acts as an insulator for the heat in the lower atmosphere. This known as a heat island. More heat retaining materials with lower albedo and better radiation absorbing properties. Rougher surfaces with a greater variety of perpendicular slopes facing different aspects. Tall buildings can be very exposed, and the deep streets are sheltered and shaded.
Urban Area Resultant Processes
) Radiation and sunshine: Greater scattering of shorter wave radiation by dust, but much higher absorption of longer waves owing to surface and Carbon Dioxide. Hence more diffuse sky radiation with considerable local contrasts owing to variable screening by tall buildings in shaded narrow streets. Reduced visibility arising from industrial haze.
2) Clouds and fogs: Higher incidence of thicker cloud covers in summer and radiation fogs or smog in winter because of increased convection and air pollution respectively. Concentrations of hygroscopic particles accelerate the onset of condensation.
3) Temperature: Stronger heat energy retention and release, including fuel combustion, gives significant temperature increases from suburbs into the centre of built up areas creating heat islands. These can be up to 8oC warmer during winter nights. Heating from below increases air mass instability overhead, notably during summer afternoons and evenings. Big local contrasts between sunny and shaded surfaces, especially in the spring.
4) Pressure and winds: Severe gusting and turbulence around tall buildings causing strong local pressure gradients from windward to leeward walls. Deep narrow streets much calmer unless aligned with prevailing winds to funnel flow along them.
5) Humidity: Decreases in relative humidity occur in inner cities owing to lack of available moisture and higher temperature there. Partly countered in very cold stable conditions by early onset of condensation in low- lying districts and industrial zones.
6) Precipitation: Perceptibly more intense storms, particularly during hot summer evening and nights owing to greater instability and stronger convection above built up areas. Probably higher incidence of thunder in appropriate locations. Less snowfall and briefer covers even when uncleared.
Method
The data, which is necessary to collect to see if my hypothesis is correct or wrong are:
) The temperature of air
2) The relative humidity
3) The wind direction
4) The wind speed
5) The cloud cover
I intend to collect this data from two different areas, one area of a surrounding with high building density and an area surrounded with low building density. I recorded the data on a table at hourly intervals for a series of 24 hours. I used this method so that I could compare my results in order to prove my hypotheses right or wrong. I collected the records for 24 hours so that I could compare the readings during the day and night.
In order to find out the temperature of the air and relative humidity I shall use the instrument, Whirling Psychrometer, this comprises wet and dry bulb thermometer mounted on a frame, which can be swung round like a football rattle. In so swinging air circulates rapidly around the wet bulb, accelerating the rate of evaporation. Readings are taken and converted into relative humidity from tables or a slide rule.
In order to find wind speed, I shall be using a ventimeter, which is similarly over a tube over which the wind passes. In order to find the wind direction I shall take the reading from www.weather.co.uk and locate the area of my favour and see which direction the wind is coming from at the precise time. The faster the wind, the greater the reduction in pressure in the tube. This causes a pointer to rise up the tube, recording wind speed. I shall estimate the cloud cover by using the rule of 0-8 Okta rule.
This is the format I shall be tabulating my results:
Time
Wind Direction
Temperature
(OC)
Temperature
(OC)
Relative Humidity %
Wind Speed (mph)
Cloud Cover
(N.E.S.W)
Dry Bulb
Wet Bulb
(1-8 Oktas)
0.00
S
4
1
70
6
8
1.00
SE
2
1
90
8
8
2.00
SE
3
1
80
3
8
3.00
NE
5
2
70
6
6
4.00
S
6
1
54
7
5
5.00
S
6
2
62
5
6
6.00
NE
7
4
74
5
7
And etc.
Results & Analysis
I will now present the raw data I collected into results tables for West Ealing and Osterley, and then portray them in the form of graphs. From the data, I will summarize and give my verdict on the results, and write small captions about any significant points on the graphs. From the graphs, it is easier to spot common trends and patterns, called correlations. This will assist me in proving whether or not my hypotheses are true.
The first table displays the data obtained at West Ealing, an area of high building density, and the second table displays the data obtained at Osterley, an area of low building density.
Time
Wind Direction
Temperature
(OC)
Temperature
(OC)
Relative Humidity %
Wind Speed (mph)
Cloud Cover
(N.E.S.W)
Dry Bulb
Wet Bulb
(1-8 Oktas)
0.00
S
4
1
70
6
8
1.00
SE
2
1
90
8
8
2.00
SE
3
1
80
3
8
3.00
NE
5
2
70
6
6
4.00
S
6
1
54
7
5
5.00
S
6
2
62
5
6
6.00
NE
7
4
74
5
7
7.00
NE
8
4
68
3
3
8.00
NE
6
2
62
5
3
9.00
N
6
1
54
4
2
20.00
N
5
0
52
5
2
21.00
NE
5
0
52
6
2
22.00
NE
4
1
70
6
3
23.00
NE
5
9
44
5
4
0.00
S
4
9
52
8
3
.00
NE
3
9
60
0
3
2.00
N
1
8
68
7
2
3.00
S
0
8
76
7
2
4.00
SE
1
9
78
8
3
5.00
SE
1
0
90
6
4
6.00
S
2
1
90
8
6
7.00
SE
2
0
80
0
7
8.00
S
3
1
80
9
7
9.00
S
4
0
60
0
2
0.00
SE
4
1
70
8
2
Figure 1: Table Of Results Obtained At West Ealing
Time
Wind Direction
Temperature
(OC)
Temperature
(OC)
Relative Humidity %
Wind Speed (mph)
Cloud Cover
(N.E.S.W)
Dry Bulb
Wet Bulb
(1-8 Oktas)
0.00
SE
3
1
80
2.5
8
1.00
NE
1.5
1.5
00
2
8
2.00
N
2
1
90
2
8
3.00
NW
5
2
70
3
4
4.00
S
5
1
60
5
4
5.00
NW
8
2
50
4.5
4
6.00
NW
3.5
0
64
2
7.00
NW
5
0
54
2.5
6
8.00
NW
1
0
90
2
8
9.00
NE
1
0
90
2
8
20.00
NW
2
0
80
2
7
21.00
NW
1
9
80
4
6
22.00
E
0.5
9
82
2
7
23.00
SE
0.5
9
82
2
7
0.00
SE
0.5
9
82
2
8
.00
SE
0
9
90
2
8
2.00
W
0
9
90
2
8
3.00
-
9.5
9
94
2
8
4.00
-
9
8
90
-
8
5.00
-
9
8
90
-
8
6.00
-
9
8
90
-
8
7.00
N
9
8.5
94
2
8
8.00
NW
9
8
90
2
8
9.00
NW
0
9
90
2
6
0.00
NW
2
0
80
2
7
Figure 2: Table Of Results Obtained At Osterley.
Figure 3: Comparison Between Temperatures Of West Ealing And Osterley
Figure 4: The Comparison Of Relative Humidity Between West Ealing And Osterley.
As I predicted West Ealing has a much higher temperature throughout the day than Osterley. This is very apparent from the figure 3, as you can see the line for West Ealing's temperature has a much steeper gradient than Osterley's, indicating a large difference in maximum temperature range. West Ealing's maximum temperature was 18OC, whilst Osterley's was 15OC giving a range of 3OC. Temperatures for both towns do meet at one point, and coincidently this point is the minimum temperature for both town of 10OC at 5 O'clock. However, despite this unique result, for most of the time the temperature for West Ealing is well above Osterley as visible in the graph.
The relative humidity also matches my predictions whereby Osterley shall have much more humidity than West Ealing. This is clearly visible from figure. 4, as the gradient for Osterley's relative humidity is well above West Ealing's on average through the period of time. However, there are few anomalies in the results, which are circled in figure. 4, as for a short period the relative humidity for Osterley is below West Ealing's, this lasts between six and seven O'clock. However, despite these anomalies, this graph also proves that my calculations for Relative Humidity was right, as you can see at five O'clock, the humidity for both towns are equal just like the temperature. Also it is clear that from the results obtained, there is on average more cloud cover in a low building density area than in the build up area of West Ealing.
Conclusion
From the results I have obtained, I have come to the conclusion that:
) The temperature of air is higher in an area of low building density than in an area of low building density.
2) The relative humidity of air is greater in an area of low building density than in area of high building density.
3) When the temperature in a particular area increases the relative humidity decreases providing the water in the air stays the same whether in an area of high building density or low building density.
4) Buildings affect the wind speed in a particular area. The wind speed is high in an area of low building density and is lower in an area of high building density.
5) I expect the cloud cover is higher, on average, in area with low building density then an area with building density.
As I expected the first part of my hypothesis to be correct because in Osterley, which is an area of low business density, there is not a lot of heat being given off in to the atmosphere due to there being fewer cars and houses than an urban area. There are also a lot of plants in Osterley, such as West Ealing and plants take in a lot of heat from the atmosphere in the form of sunlight; especially, the tall plants such as trees.
In West Ealing, which has a high building density, there are lot more cars and surrounding houses. Cars give off huge amounts of heat through the engine and the exhaust pipes and houses give out heat through windows and doors as well as through the roof. Vast amounts of pollution are exposed to the atmosphere from factories. The smoke, from the factories, acts as an insulator for the heat in the lower atmosphere, this explains the high temperature range and the low level of humidity.
Evaluation
In my personal opinion I believe this investigation was a success, in the sense that the results corresponded with my predictions. I do believe that my results were quite accurate, however, there might have been several factors, which could have caused some anomalous results. Such as the ventimeter, moisture would enter leaving the tube dry, which made it difficult for the ball or marker to move up. In order to get around this obstacle I used chemically treated pipe stem cleaner to clean any moisture remaining. Another problem with the investigation I encountered was the fact that I could not be at two places at one time. So I had to instruct another person to take the readings, this can cause the problem of the fact that his reading maybe different from the readings if I took them. So this reduces the idea of one hundred percent accuracy.
One way in which this investigation can be taken further is to expand to a bigger area, such as whole countryside against a temperature of a town or city as a whole, or you could investigate the reasons of the high level of temperature in an urban area such as London. I feel this experiment could have been improved by using more automated instruments such as digital whirling phycrometer and ventimeter that you can just read off the readings of a small LCD screen.
1