Public Health: How are current patterns of ill health monitored? How have current patterns in the UK changed and how has the government influenced them?
Ian Lowenhoff Unit 12
Patterns of Ill Health
How patterns of ill health are monitored (P3)
In the UK patterns of ill health are identified and monitored through the use of statistics which may be viewed on the National Statistics website. Responsible for producing statistics to be put together by our UK National Statistics organisation to illustrate patterns of ill health in the UK are government statistical departments. Government statistical departments that are major contributors to identifying and monitoring patterns of ill health in the UK include: the Department of Health, the Health and Safety Executive and the NHS Information Centre for Health and Social Care.
Statistics are collected from records such as birth certificates, the death register and records of hospital admissions. These records may then be further analysed as they will contain much more specific information such as the weight of the baby that was born or the reason that an individual was admitted to hospital. Records such as hospital admissions and arrests have been made a legal requirement by our government so that statistics will always be available. Statistics are also collected from surveys such as the national census survey which is conducted every 10 years in the UK by the government. The national census survey has been taken since 1801 and counts everyone in the UK and their households. It provides a detailed picture of the UK and allows us to compare geographical areas. Although statistics do provide a clear picture, they are not totally accurate for what they represent because there will always be a clinical iceberg. The term clinical iceberg is used to describe how there will always be information on illness that is not reported so statistics can only give us an idea of what ill health in England is really like.
Patterns of ill health are also identified using reports such as the black report conducted in 1980 which found that there were gross inequalities in health at the time, by illustrating that the death rate of men in the lowest social class was twice as high as the death rate of men in the highest social class and the gap of inequality between them was increasing not decreasing as was expected.
Current patterns of ill health in England (P3)
There is currently a vast amount of various patterns of ill health in the UK today. I am going to describe three patterns that relate to ill health comparing them with each other and looking at how they vary in different geographical places in England: Chopwell and Sunbury. The patterns that I have chosen to look at are listed below. In order to describe what these current patterns are and how they have changed over time I have used the neighbourhood statistics website (the link of which is shown in the bibliography).
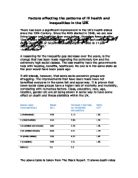
- Cancer: the amount of people who have cancer in England is monitored by reviewing the recorded admissions to hospitals where cancer was the reason for the admission. It is important to note that the statistics of these records only date back to 2008 so do not represent the cancer admissions of today but do give us a good idea of what they are like. It is also important to note that this statistic includes diagnosis admissions so a lot of the people admitted may not have had cancer after all but even so we still are able to get an idea of the numbers of people with cancer when we compare different areas. As is the case with every statistic of ill health cancer admission rates vary from place to place; the average amount of admissions to hospital in 2008 due to cancer in England was 1,326,050. Looking at the table below we can see that the amount of people admitted to hospital in England due to cancer has risen steadily over the past couple of years.
To show how rates of admissions vary for cancer around the country I will now compare cancer admission rates in Spelthorne to cancer admission rates in Chopwell.
Cancer admission rates for Spelthorne were last recorded in 2008 as being 2,290 which is up from the earliest time of recording (2003) when the admission rate for cancer in Spelthorne was 2,177. However in the year of 2005 this rate dropped to 1,937 which shows that the admission rate for cancer to hospitals in Spelthorne is not significantly changing and is staying around the 2,000 mark.
In Chopwell the admission rate for cancer in 2008 was 5,248 and from looking at the statistics from previous years also dating back to 2003 you can see that this rate has had no significant change and has stayed at around 5,000 admissions each year.
Comparing the data we can see that admission rates for cancer are much higher in Chopwell than in Spelthorne with Spelthorne admission rates for cancer averaging at about 2,000 a year and Chopwell admission rates for cancer averaging at about 5,000 a year.
- Life expectancy at birth for males: by life expectancy at birth, we mean how long we expect an average individual to live after they have been born. Please note that the current statistics available are from 2009 and not the current date (2011). In 2009 the average life expectancy of a male born in England is 78.3. This life expectancy age is not the same for everywhere in England some places are better and some places are worse due to various factors affecting the quality of life in those areas. Fortunately no places life expectancy is decreasing though and as a whole England’s life expectancy age has been rising for years as we can see from these statistics shown in the table below. Based on these past statistics we can also predict that life expectancy will probably increase next year and for many more years to come in the future.
I mentioned in the previous paragraph that in some areas life expectancy in males is better than the average in England whilst in other places life expectancy in males is worse. Now I am going to prove that point by showing some statistics from my chosen geographical areas.
The current life expectancy age for males born in Spelthorne today is almost two years higher than the average age in England at 79.9. Like the average life expectancy for males as a whole in England, this statistic has been increasing for years and this can be illustrated by looking at the life expectancy for males in Spelthorne in January 2000 to December 2002 which was 76 – almost a 4 year difference.
The current life expectancy age for males born in Chopwell is almost two years lower than the average in England at 76.4. Although this statistic is lower than the average in England, it has been steadily increasing from 74 and has risen by about 2½ years in 9 years time.
Comparing Chopwell and Spelthorne we can see that life expectancy is much lower in Chopwell than in Spelthorne and has been for years. Later I will explain why these patterns are how they are and why they may change.
- Road traffic collisions which lead to death or serious injury: by road traffic collisions we mean when a vehicle collides/crashes with another object (usually another vehicle). The latest statistics available for road traffic collisions date back to 2003. In England in 2003 there were 14,631 serious injuries or deaths caused by road traffic collisions. Looking at the statistics in 1999 we can see that the rate of people being seriously injured or killed has been steadily decreasing.