Maths Coursework -
Handling Data
By Daisy Townsend
February '03
PLANNING
I have been given all the names and records of each pupil in our year - both the boys and girls. I have a record of athletics for everyone that is in the year 10 - including either the times or distances of 100m, 200m, 1500m, shot and also discus. There were several questions that I considered investigating, such as:
Are boys generally better than girls at athletics?
Are girls faster sprinters than boys?
Who is better at 100m sprinting - boys or girls?
Which of the sexes can throw furthest?
Are boys better at running long distances, more so than girls?
I have decided to investigate which gender can run the 100m in a short distances - boys or girls? I have decided to use the 100m records for our year, as this contains exactly the information I am looking for.
I think that boys will be able to run faster than girls. There are two main reasons why I think this - one being the fact that boys are generally stronger than girls and therefore to be more physically fitter. Also, boys have developed muscles and grown stronger than the girls my age. Most boys are more physically active than girls (i.e. with football) and this may have made them a lot fitter. Therefore my hypothesis is that boys can run faster than girls in the 100m.
To see if this hypothesis is correct, I will first need to collect my data fairly so I can begin to find out if this hypothesis is correct. To start with, I will gather all the data for all the pupils in my year in this event and then their distances. I will delete all the students that have missing times for whatever reason, as these aren't of any use to me. Then I will randomly pick the sample data, by putting all my data into two lists - one for the boys and one for the girls ...
This is a preview of the whole essay
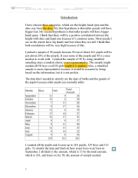
To see if this hypothesis is correct, I will first need to collect my data fairly so I can begin to find out if this hypothesis is correct. To start with, I will gather all the data for all the pupils in my year in this event and then their distances. I will delete all the students that have missing times for whatever reason, as these aren't of any use to me. Then I will randomly pick the sample data, by putting all my data into two lists - one for the boys and one for the girls - and pick the first out of every three. As there are more girls than boys in our year, there will be more girls on my sample. I needed an equal amount of each of the sexes so I erased all the girls that went over the amount of boys I had (in this I deleted the records of the last ten girls so there was an equal amount to the boys)
I should then have about one third of the times for the students in year 10. All this data will also be completely random so I can ensure it is a fair test. My sample avoided any bias, simply by following the procedure that I mentioned. This would mean that it the sample data that I had collected would be fair, and therefore should have avoided any bias results.
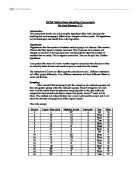
I first found the average for the shot, for both the boys and the girls. To find the mean for the boys I added all of the times together. I then divided this sum by the number of times I had - this was 67 different times in total. This gave me a mean for the boys, and I then did so again with the girl's records to find an average for them.
The mean looked like this:
The average time taken to run the 100 metres was 17.00 seconds for the girls
The average time taken to run the 100 metres was 15.84 seconds for the boys
As predicted, boys were generally more able run the distance faster than the girls. The mean shows this - the majority of boys must have ran faster than the girls for me to have came to this conclusion. This proves that my hypothesis was correct.
This doesn't mean that every boy in my year ran the 100 metres faster than all of the girls - it just means that the majority if them ran it in approximately 16 seconds, whereas the girls had a time that was likely to be near 17 seconds.
The difference between the two averages (boys and girls) wasn't as big as I had initially expected - I did think that there would be a wider gap. However, in fact there was only a difference of 01.16 seconds, so the boys are only just faster than the girls on average.
Out of the sample times that I collected, the minimum time for a girl to run the distance was 14.02 seconds, which was considerably below the average time for the other girls and even the boys. However, the boys' minimum time was 12.70 seconds, which was much lower than the averages and faster than any of the girls. This shows that if my sample population is anything to go by, boys are faster runners than girls. The fastest boy in our year ran the 100 metres in less time than the fastest girl.
The maximum time for the 100 metres was 21.60 seconds for the boys and 24.00 seconds, which is quite similar to the minimum times - as it too shows that even the slowest boy in my sample populations can run faster than the slowest girl.
All these calculations add to my evidence to show that boys are faster sprinters than the girls.
I have now written down all of my results - including the mode, mean, and median, frequency graphs and cumulative frequency graphs.
After I had collected my data and had a mean I could immediately begin to see what sort of distances I could be expecting from students and start doing more advanced calculations to investigate further. I scanned the sample to see if there were any records that didn't look quite right - by either being much too small or considerably much larger than others. Though there was a few distances that were either much above or below the mean, there weren't any that I thought weren't possible, and therefore no bias.
The thing that I noticed from my results were that in all my calculations - such as averages and frequency graphs, all of them had one thing to show, which was boys were faster. For example, when I did the mean, I discovered that boys on average were faster than girls and when I did the minimum times I saw that the fastest boy in our year was faster than the fastest girl in our year, and other such observations. I didn't actually find a calculation or graph that showed that in generally, girls were faster than boys. From this, I can assume that my hypothesis - that boys are faster at the 100 metres - is correct. Therefore my conclusion is that the boys in my year are faster than the girls. This may not be the case, however, with perhaps other schools or even areas - as I only had a sample population for my year. There could even be a difference in the years below or above myself - perhaps, for instance, the girls are faster than the boys in the year above me. I would be interested to see if my results would be anything similar to the results of other groups - like other schools, ages or possibly something wider such as area.