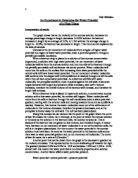
Using this concept we can deduce that the point on the graph where the curve of best fit crosses the x-axis, the x intercept, is the point at which the sucrose solution is the same as the solution in the beetroot cells, the solution is isotonic. This is because if the beetroot has not gained or lost volume, and therefore length, it means there has been no net movement of water molecules in or out of the beetroot cells, the cell is in incipient plasmolysis. For this to occur the water potential in the sucrose solution must have been the same as the water potential in the beetroot cells and so there was no water potential gradient and no net movement of molecules. The curve of best fit meets the x-axis at 0.33moldm-3.
Another point that can be drawn from the graph is the decrease in gradient as the molarity increases. This represented by the curve shallowing off towards the right. The gradient between 0.0M and 0.2M is –19.8 and between 1.0M and 1.5M is –9.44, almost half. His means that water potential is not directly proportional to solution concentration. Another factor affects water potential, pressure.
Water potential = solute potential + pressure potential
When a beetroot strip is placed in to a hypotonic solution, water molecules begin to enter the cells. This causes the water potential to increase as the concentration of solution within the cells becomes more dilute. However, as this happens the pressure within the cell increases, this means a larger amount of molecules now occupy the same space. The molecules collide more often inside the cell so have more kinetic energy; therefore this increases the chance of water molecule hitting the cell membrane with enough energy to escape. This increases the water potential within the cell and reduces the net movement of water molecules into the cell. So we can say increasing pressure increases water potential.
Conversely in hypertonic solutions, as water molecules leave the cell the pressure potential stays at zero.
In conclusion, the average solution within the beetroot cells is 0.33 moldm-3. The general trend, that as molarity of sucrose solution increases average percentage change in length decreases, is described by osmosis. Also the reason the gradient decreases as molarity increases is due to increased pressure potential within a cell when it becomes turgid, which increases water potential.
Evaluation
The results obtained fell on or near to the curve of best fit on the graph except for the result obtained for 0.3moldm-3 sucrose solution, which was a higher value than the one before. This goes against the science outlined earlier. Therefore we can say this result is anomalous and has been circled on the graph. There are a number of reasons for this
A large source of error within the experiment is the cutting of the beetroot strips. Due to the difficultly of cutting rectangular strips by hand with a scalpel not all the sides will be at 900. This means when measuring the length it is not clear where to measure from, therefore the recorded results will not all be the same as the actual length. This is a source of error.
Another problem within the procedure it that it is impossible to ensure that scalpel enter the beetroot at exactly the same angle. This means, if we assume the cells are running in a similar direction, a different amount will be damage each time. The more diagonally the scalpel enters the beetroot the more cell walls will be cut, making the results inaccurate. The larger the volume of beetroot used the smaller the percentage error will be. If the procedure were repeated then using larger strips and always cutting from the same direction would make the results more reliable.
When the strips are being cut they are losing water by evaporation. This lowers their water potential, and because this time will be slightly different for each strip, it will lead to inaccuracy within the experiment. Conversely when the strips are put in the solution initially their length must be read as quick as possible because from the moment they are put in they gain water molecules and change length. As they cannot be measured instantly, the rate of osmosis varies and they are each measured after a different amount of time this creates inaccuracy.
One source or error came from the instruments used. The graduated 10 cm3 pipettes could measure to 0.1cm3. This meant that each time it was used it could be out by 0.05cm3. Also the graph paper also only measured to 0.1cm so could also be out by 0.05cm. This is potentially a huge source of error. If we say the results could be out by 0.05cm then the results for 0.0 moldm-3 solution could have up to a 38% error. This is over a third. Obviously the error would not be this big but potentially it could be and it does create huge inaccuracy within the results.
The beetroot strips did not grow evenly all over but swelled in some places my than others. Meaning the length recorded was not always and accurate representation of the water molecules absorbed.
In this experiment only 3 strips were placed in each petri dish, although this did help even out problems, it would have given more reliable results if more strips were used. As well as measurements at more moralities, perhaps every 0.05 moldm-3, would have allow a more accurate curve to be plotted as there would have been more points.
If the sucrose solution had not been shaken thoroughly enough the sucrose may not have dissolved completely and the molarity would have been different to what it was labelled. This would have cause inaccuracy. This is unlikely to have happen if the procedure was carried out well.
A large potential source of error was due to that fact that the cells within beetroot have very varied water potentials because of the different amounts of salts and sugars in there vacuoles. This means not all of the strips would have had the same water potential so this varies the results and places another limit on the results.
A different experiment would be to use the same procedure used above but use a pan balance and measure mass to 3 decimal places. This would create much less percentage error than measuring length.
Another way off measuring the mean molarity concentration of cell sap within beetroot cells is to cut ‘chips’ of beetroot. Each one should be 5×5mm and less than 0.5mm thick. Place three chips into different molarity solutions and leave for about 30minutes. Then remove and using a microscope count to amount of plasmolysed cells per 200 cells. The molarity at which 50% of the cells are plasmolysed is the molarity within the cells.