Hypothesis
By increasing the concentration of a Sucrose solution it will result in the loss of water molecules from the Celeriac tissue until the equilibrium has been reached. This will cause a decrease in mass and length of the tissue.
A Fair Test
To ensure that this test is fair and to get the most accurate results possible we must follow the following rules:
- Separate test tubes must be used for each solution made
- Two measuring cylinders must be used, one to measure the sucrose solution only and one to measure the distilled water only
- The same volume of solution must be used each time (40cm³)
- All celeriac tissue samples must be cut from the same piece of celeriac
- The celeriac samples must all be cut to the same length (5cm)
- A new piece of paper towel must be used to blot dry each sample
Equipment
Below is a list of equipment that will be used during our investigation. As well as that listed we will be wearing gloves and a laboratory coat to protect ourselves and ensuring that we are working in a safe environment. We must also make sure that we are careful using the scalpel and borer when cutting the celeriac samples, and also that we are aware of those around us and what we are doing.
18 Test tubes
2 Test tube holders
Cork Borer
2 50cm³ measuring cylinders
1M Sucrose solution
Distilled Water
Celeriac
Scalpel
Paper Towel
Ruler
Scales
Cutting Board
Cotton Wool
Method
- 18 test tubes were labelled, 3 for each concentration of solution with the molarity of the solution and sample number written on each and then placed in test tube holders
- Using two 50 cm³ measuring cylinders (1 for Sucrose and 1 for Distilled Water) the following solutions were created using 1M Sucrose and Distilled Water and added to the relevant test tubes.
- 18 Cylinders of Celeriac were cut using a borer approximately 5mm in diameter. Using a scalpel each knife each sample was carefully measured and cut to be 5cm in length on a cutting board and then blotted with paper towel to remove any excess moisture.
- The mass and length of each sample was then measured using scales with an accuracy of ± 0.01g and a ruler, and the details were recorded in a table. The samples were then placed in the appropriate test tubes.
- The test tubes were plugged with cotton wool and then placed in a fridge for 21 hours and then on a work bench for a further 26 hours at room temperature.
- The samples were then individually removed from the test tubes and immediately blotted with paper towel to remove any excess moisture, they were then measured for mass and length using the same scales and ruler, and the results recorded in the table.
- The percentage change in mass and length of each sample of tissue was calculated using the formula :
and the mean average percentage change of the 3 results for each molarity was calculated by adding the 3 results together and dividing the total by3, the details were recorded in the table.
-
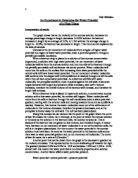
A graph was then plotted using the mean percentage change in mass and length results from the table with the mean percentage change on the Y axis and the Ψ of the Sucrose solution on the X axis. The points in red were labelled as the results for the change in mass and the points in green were labelled as the results for the change in length.
-
A line of best fit was then drawn with an equal number of points on each side of the line, and the point where the line for the mean percentage change in mass crosses the X axis equates to the Ψ of the celeriac tissue.
Results
Mass
Length
Analysis
By observing my results in table and graph form I can see that Celeriac has an approximate water potential of -2.3MPa. This is taken from the graph at the point where the line of best fit for the percentage change in mass crosses the X axis. I have chosen to take the point from the change in mass results because these are generally known to be more accurate and precise. This is because celeriac is a plant and therefore its cells have cell walls which prevent the cells growing too much when they diffuse water molecules.
A negative percentage change in mass and length which can be observed from my results when the sucrose solution used was 0.8M and 1.0M, shows that the water potential of the sucrose solution is lower than the water potential of the celeriac. This would result in the net movement of the water molecules diffusing out of the celeriac cells, causing the cytoplasm to shrink away from the cell walls (Plasmolysis) and the cells to loose mass and length.
A positive percentage change in mass and length which can be observed from my results when the sucrose solution used was 0.0M, 0.2M, 0.4M and 0.6M, shows that the water potential of the sucrose solution is higher that the water potential of the celeriac. This would result in the net movement of the water molecules diffusing into the celeriac cells from the solution which would cause a gain in mass and length of the tissue.
My graph shoes the basic concept that as the concentration of the sucrose solution increases, the smaller the positive percentage change in mass and length and the greater the negative percentage change in mass and length occurs. Therefore my Hypothesis was correct.
Between the ranges of 0.0-1.0 molarity of the sucrose solution there is a 59.04% change in mass and a 17.33% change in length of the celeriac tissue through a gain or loss.
The first result to be obtained using the 1.0M sucrose solution is an anomalous one as the trend that is followed after this result suggests that there should have been a greater loss in mass and length. Reasons for this anomalous result are suggested in my evaluation.
Evaluation
Overall this experiment went well and the results came out as predicted, however the first result that was obtained using the 1.0M sucrose solution is an anomalous one as the trend that is followed after this result suggests that there should have been a greater loss in mass and length. This anomaly could have occurred because of the following limitations:
Beakers & Measuring Cylinders
When measuring out the sucrose and distilled water to make the solutions in the measuring cylinders we used beakers to measure each quantity. This could have affected the results because by increasing the concentration of the solution decreases the water potential of that solution and would therefore have an affect on the osmosis taking place.
An improvement for this would be to use a graduated pipette as these allow for more accurate measurements to be obtained without having to transfer the liquids from one container to another before adding the samples.
Borer
The first borer that was used to obtain the tissue samples broke three quarters of the way through the investigation, which meant that a new borer had to be used. This new borer may not have had the same dimensions as the original which could have produced different shaped tissue samples with different surface areas for osmosis to take place across.
An improvement for this would be to complete a thorough check of all equipment before starting the investigation and ensuring that everything is used carefully and in the correct way.
Time
Once the celeriac samples were placed into the sucrose solutions they were left for 47 hours. Usually when this experiment is carried out the samples are left for only 24 hours. Leaving them for a longer period could affected the results because the tissue samples would begin to decay over time and this would affect the amount of cells that osmosis could take place across.
An improvement for this would be to leave the samples for only 24 hours before removing them from the solutions and re-measuring.
Placement
During the 47 hours that our samples were left, for 21 hours they were placed in a fridge. The colder temperature would have resulted in higher water retention in the tissue samples which means there with the higher concentration solutions it would have been harder for osmosis to occur, because it would have been harder for the water molecules to diffuse out of the cells.
An improvement for this would be to leave the samples for 24 hours on a counter top at room temperature.
Excess Moisture
After removing each sample of celeriac from the solutions we blotted them dry with paper towel to remove any excess moisture before weighing. If the samples were not properly dried before weighing this would have increased their mass which would affect the mean percentage change in mass once calculated.
An improvement for this would be to ensure that each sample was blotted dry thoroughly and using a new piece of towel for each sample. This would ensure that there was as much excess moisture as possible removed before weighing again.
Submersion
When the celeriac samples were placed into the sucrose solution not all of them were completely submerged in the solution. This would have decreased the surface area on which osmosis could take place across and would therefore affect the rate at which osmosis takes place and the final mass and length of the tissues would not be correct.
An improvement for this would be to weigh down the samples before plugging the test tubes so as to ensure that as much of the tissue was submerged in the solution as possible.
Cell Types
The celeriac samples were cut from different parts of the same celeriac, so each sample would contain different types of cells and each type of cell would have slightly different water potential which would affect the results as osmosis would happen at different rates around the sample.
An improvement for this would be to ensure that the tissue samples were cut from a similar area of the celeriac to ensure that the same type of cells were present in each solution.
Our end results could be said to be unreliable because of the above factors and limitations. This statement could be further supported by looking deeper into the results and noticing that the 3 individual results obtained for each molarity of solution were quite varied and not consistent in the amount that they gained or lost in both mass and length. This would have an affect on the approximate Ψ of the celeriac because if the 3 results had been more consistent the mean percentage changes would have been different which would then affect the graph and were the line of best fit crosses the X axis, which is were we have chosen to take that figure from.
The main sources of error for this experiment from the list above would be Excess Moisture and Submersion and the reasons why these would both significantly affect the results when re-measuring the tissue samples are suggested above. The other factors and limitations could not conclusively or substantially affect the individual results obtained for each concentration of solution and would therefore not have a major affect in the outcome of finding the Ψ of the celeriac.