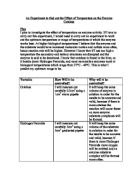
The catalase I am going to use will be obtained from a pig’s liver. The liver will be homogenized and then centrifuged to obtain a pure sample of extract. This process will help me to obtain a sample of enzyme solution which is similar in concentration, plus remove any excess materials which are present in the liver but not required for the reaction. My independent variable is temperature and I plan to measure it using a thermometer. I will measure the reaction every five seconds for forty seconds, as I believe that by forty seconds most of the reaction would have occurred. I am using the temperatures 20°C, 30°C, 40°C, 50°C, 60°C, 70°C because catalase is a mammalian enzyme I expect it to work best at the temperature range of 37°C – 40°C. I will ensure a quick mixing of the enzyme and substrate by squirting the reactant into the boiling tube. I am aware that when squirting the hydrogen peroxide into the boiling tube I am in fact increasing the pressure in the tube and forcing gas through the system. This may effect my results, however since the same amount of pressure is added each time it should not affect any of the trends I may find. The delivery tube is constructed from rubber tubing and forms an air tight seal so that no gas is lost. When I seal the system, air will be trapped inside, so the oxygen expelled by the reaction may not actually reach the gas burette, instead it may just force the air present inside the system into the gas burette, hence I predict that my glowing splint may not relight as it is unlikely to be exposed to pure oxygen. Before reacting the enzyme plus buffer, I will leave them in the water bath for ten minutes, prior to mixing, in order to allow the temperature to equalize. I will not put the Hydrogen Peroxide into the water bath because I believe that with the increased molecular motion the Hydrogen Peroxide may break down faster and give me invalid results. At each temperature I intend to carry out three repeats if the first two attempts vary in value. I am using only five centimeters cubed of hydrogen peroxide because if I were to use any more the gas expelled would be in excess of the volume me gas burette measures. In order to check the amounts of reactants, I stated earlier, were right I must also carry out a preliminary test, in this I plan, at room temperature, to check which pH buffer to use and check the liver extract and hydrogen peroxide are at a measurable concentration. Since the enzyme is found in the liver I expect it to work best at neutral pH conditions. With the data I collect I intend to put it into tables and plot graphs, so that any trends become visible. As a control I will boil the liver extract, in order to denature the catalase in it, and then test it at the optimum temperature. If it does not work at this temperature then I doubt that it would work at any of the other temperatures. I expect the graph to look something like the one shown below:
Rate of Reaction
Temperature
Method
I set up the apparatus as in the diagram from the plan. The mixture in the boiling tube contained: 0.5cm3 of pH buffer, 5cm3 of Hydrogen Peroxide, 0.1cm3 of Liver Extract. I change the volume of the liver extract I used because it was much more concentrated than I predicted, so I used a smaller volume than the planned 0.3cm3. Also using the results I gained from conducting my preliminary experiment I found that the optimum pH buffer for my reaction was pH 8. I used a micropipette to measure out the volumes of liver extract and pH 8 buffer. However I did not use a graduated pipette to measure out the Hydrogen Peroxide because I found it easier to squirt the Hydrogen Peroxide into the boiling tube by using a 5cm3 syringe, hence this what I used to measure out my Hydrogen Peroxide volumes. I controlled the volume of liver extract added to the mixture in each reaction, because if there was more catalase in the solution then the Hydrogen Peroxide would be broken down faster and my results would not be valid. I wore my safety goggles to protect my eyes from the Hydrogen Peroxide and pH buffers. I recorded my results every 5 seconds for 40 seconds from when the reaction started. This allowed me to obtain results from which I could calculate the speed the reaction is working at.
I repeated the experiment with all 6 temperatures so the data I obtained would be valid a comparable. However the planned temperatures proved harder to obtain than I predicted, so I measured the reaction at the following temperatures: 25°C, 35°C, 45°C, 50°C, 60°C, 72°C. I repeated each temperature three times so I could obtain reliable results once an average had been calculated.
Another change from my plan was to test for oxygen using a glowing splint. I did not carry out this part of the plan because I realized that when I seal the system, air will be trapped inside, so the oxygen expelled by the reaction will not actually reach the gas burette, instead it may just force the air present inside the system into the gas burette, hence I thought that my glowing splint would not relight as it is unlikely to be exposed to pure oxygen. Another reason I did not test for oxygen is because in some of the reactions only a small amount of oxygen would be released and may not be enough to re-light the glowing splint, in addition the oxygen collected woud be located at the top of the gas burette and my splints were too short to reach that far up the gas burette.
I controlled the pH by adding 0.5cm3 pH 8 buffer to every reaction so that hydrogen ions or hydroxide ions were kept constant because they may affect the rate at which the catalase functions.
I controlled the volume of catalase each time because if there is more catalase in a specific reaction than in the other reactions it will occur faster as more enzyme substrate complexes will be formed.
I controlled the volume of the Hydrogen Peroxide each time because if there is more Hydrogen Peroxide in a particular experiment more oxygen will be emitted, because enzyme substrate complexes will be formed more often.
I controlled the light intensity by keeping the Hydrogen peroxide in a brown jar and conducting the entire experiment in the same room. If the light intensity was varied it may have forced the Hydrogen Peroxide to break down faster.
Results
Preliminary experiment results to work out optimum pH around neutral conditions, at room temperature:
ph 6
ph7
ph8
pH 9
Results obtained from experiment:
25°C
35°C
45°C
50°C
60°C
72°C
Conclusion
The results from my preliminary experiment clearly show that the optimum pH for the enzyme catalase is pH 8, in the particular sample that I used. This shows that the enzyme prefers to work in slightly alkali conditions. This is why I chose to use pH buffer 8 in my experiment.
The general trend of my graphs shows that the amount of oxygen evolved is highest in the middle of the range of temperatures I investigated. However the pattern is not smooth and tends to fluctuate, this can be put down to some small experimental error. But from the graph it is still easy to see that there is an optimum temperature for the enzyme catalase around the mark of 35°C.
The graph which shows the amount of oxygen evolved after 15 seconds, and supports the first set of results, of the catalase having an optimum temperature around 35°C. It also shows that there is a general correlation in the amount of oxygen released as the temperature rises and how the amount oxygen released decreases as the temperature becomes too high, when the enzyme denatures. I had been concerned that by 15 seconds the reaction would be near completion and I would not have been able to see the pattern, but clearly it has not.
In the graph which shows the speed at which catalase works at different temperatures the fastest two lines are of 35°C and 45°C. This supports the idea that I had of catalase being a biological enzyme and having an optimum temperature between the temperature range 37°C – 40°C.
At the optimum temperature the conditions could be perfect for the enzyme to function in. It could be using the lock and key theory where the active site and the catalase fits perfectly with the Hydrogen Peroxide molecule. Another way of stating this is that the active site in the catalase is exactly complementary to the Hydrogen Peroxide molecule.
Enzyme-Substrate Complex
Enzyme
Substrate
Or it could be using the induced fit theory.
This theory suggests that the enzyme is not
exactly complementary until the substrate is
bound.
Enzyme-Substrate Complex
Enzyme
Substrate
At the optimum temperature the molecular motion of the enzyme and substrate are moving the most, without denaturing the enzyme, hence the enzyme and substrate work best as they are colliding into each other more often.
I investigated the pH in my preliminary experiment to find the optimum pH level that catalase works at, so that I could keep this pH constant while the varying the temperature. At optimum pH the charges on the enzyme and substrate may be strengthened, so that they attract more. If this happens then the catalase will work faster as there are more Hydrogen Peroxide molecules being attracted into the active site.
Outside Optimum pH Optimum pH
Outside of this pH range the attractive and repulsive charges will be lost and the enzyme will slow down.
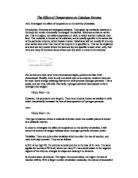
I expected to find what I found, with the optimum temperature between 37°C-40°C. This is the graph that I expected to obtain from my results:
Rate of Reaction
Temperature
This is similar to the one that I obtained except for the lack of results on the rising slope.
Evaluation
During the experiment I realized that the exact number of enzymes added each time would vary since they are so small, in size. Even though the micro pipette is very accurate it does not count the exact number of enzymes present, only the volume of liquid. Since the enzyme catalase works at six million times per minute a tiny amount of them can make a significant change to the results I obtained. The micro pipette measured to 1000μl, which is very accurate and any variation in catalase used is negligible. However the micro pipette may be responsible for the wide range of results, as shown on the scatter graph, at 45°C. Considering this it may not have affected my results in an adverse way since there is a downward trend after 35°C anyway. So it would not have affected any conclusions that I have drawn.
The high reading of oxygen evolved after 15 seconds at 25°C on one of my graphs may be from the force at which the Hydrogen Peroxide was added to the catalase and pH buffer. This could have affected the results as if the syringe was emptied quickly it would mix with the catalase in the test tube faster, giving the catalase more Hydrogen Peroxide to break down at an earlier point in time. This had an affect on the earlier points on my graphs, but not on the general pattern and hence would not have affected any conclusions that I have drawn.
If I did this experiment in the future I might unhook the delivery tube each time I wanted to measure a reading from the gas burette. This would help as I would have more accurate readings by creating more time to collect the measurements. I would also use a more accurate syringe to measure out the Hydrogen Peroxide so that the same amount of substrate was added to each reaction, thus giving me more reliable results. It would also help to support the conclusions that I have drawn from this experiment.
The evidence I collected is what I expected to find, however in my opinion it is not enough to produce a firm valid conclusion. The maximum yield of oxygen at 35°C is roughly normal although I do expect to find that the optimum would be a little higher, than the max yield that I obtained. In order to produce a firm valid conclusion I would have to repeat the experiment on the temperatures between 35°C-45°C, so that I could find out the exact optimum temperature. Also I would have to conduct the experiment at lower temperatures, on the rising curve, so that I can obtain a full reaction rate curve.
I could have also measured the pH in every reaction instead of just relying on the pH buffer to do its job. This would have further validated the results I obtained.