I have decided to measure the rate by following the volume of gas produced by collecting the gas in a burette and timing the taken to collect 30cm3 of gas. The rate can then be worked out in the following way:
Rate=30/Average Time
This gives the rate in cm3 of oxygen produced per second, as I am timing how long it takes to produce 30cm3 of oxygen.
VARIABLES
For a fair test I must only vary 1 variable and that is the thing I am investigating (independent variable), all the remaining variables must be kept constant. I have to make sure this experiment is a fair test because if not it will affect the accuracy of my results, and as a consequence I will be unable to compare my results fairly and calculate a precise molar heat of combustion. Therefore I will not be able compare my results to the theoretical results fairly and as a consequence the conclusion I will draw will be inaccurate.
-
The independent variable - is the variable I change and in this investigation it is the concentration of hydrogen peroxide. I will use 5 concentrations of hydrogen peroxide at 2% intervals: 2%. 4%, 6%, 8% and 10% hydrogen peroxide.
-
The dependant variable - is the variable that depends on the independent variable and the variable I measure. In this investigation it is the time taken in seconds to collect 30cm3 of oxygen.
Controlled Variables: are variables I must under all circumstances keep the same to ensure I am conducting a fair test.
-
The temperature must be kept the same. This is because an increase or decrease in temperature alters the rate of an enzyme-catalyzed reaction. With a rise temperature the rate increases, whereas with a drop in temperature the rate decreases. If the drop or rise in temperature is significantly big enzymes become denatured or inactive, and thus no reaction occurs. I will control the variable by carrying out the whole experiment at room temperature, in the same room and at the same time.
-
The pH must be kept constant. This is because at pH7 or neutral there is maximum rate, whereas for the majority of enzymes extremely high ph (acidity) or low pH (alkalinity) results in complete loss of activity, and therefore no reaction. I will control this variable by adding neither acid nor alkali to the hydrogen peroxide and yeast.
-
The same type of enzyme must always be used. This is because enzymes are substrate specific, and the enzyme catalase is specific to hydrogen peroxide. By this I mean the shape of catalases active site matches the shape of the hydrogen peroxide substrate molecule, and this enables the reaction to take place. Thus if any other enzyme such as Cymotripson or Acetylcholinsterase was used no reaction would occur because it’s active site would not match the shape of the hydrogen peroxide substrate molecule. I will control this variable by always using catalase.
-
The enzyme concentration must be kept constant as an increase or decrease in concentration alters the rate of an enzyme-catalyzed reaction. This is because in solutions of high concentration reactant particles are close together causing them to collide more frequently, hence the reaction is fast. Whereas in solutions of low concentration reactant particles are far apart so there are only infrequent reactions, therefore the reaction is slow. I will control this variable by always using 10% yeast, and before measuring 0.5cm3 of yeast using a 1cm3 syringe I will always stir the yeast. This is in order to achieve a uniform solution of equal concentration.
-
The source of the enzyme must be kept. This is because a different enzyme sources such as applies, potatoes and liver will produce different concentrations of enzyme. Also this introduces biological variation, by this I mean that although the same source is used the the catalase concentration will vary from apple to apple, potato to potato and liver to liver. This is because each apple, potatoes and liver is different, none are clones. I will control this variable by always using yeast catalase.
-
The yeast used my always come from the same batch. This is because different batch of yeast may vary slightly in concentration, as a consequence the catalase will vary in concentration. This would lead to inaccuracies because in solutions of high concentration reactant particles are close together causing them to collide more frequently, hence the reaction is fast. Whereas in solutions of low concentration reactant particles are far apart so there are only infrequent reactions, therefore the reaction is slow. I will control this variable by carrying out the investigation i.e. all the experiments using one and the same bath of yeast
-
The volume of enzyme used must be kept constant. The reason for this is that an increase or decrease in concentration will alter the rate of an enzyme-catalyzed reaction. If the volume of enzyme increase there will be more active sites present for the substrate molecules and thus the rate will increase. If on the other hand the volume of enzyme decrease there will be less active sties present for the substrate molecules and the rate will decrease. I will control this variable by always using 0.5cm3 of yeast catalase, which I will measure using a 1cm3 syringe.
-
The volume of oxygen to be collected must always be the same. This is because if it is increased or decreased the calculated rate will be faster or slower than it should have been and as a result inaccurate. I will control this variable by always collect 30cm3of oxygen in a burette, which measures to 50cm3 and is accurate to 0.05cm3.
-
All the same apparatus must be used throughout the whole experiment. This is to reduce any possibility of measuring errors or other possible errors which would affect the accuracy of the final results. I will control this variable by simply always using all the same apparatus.
- When measuring the volumes of hydrogen peroxide and water the measurement should always be taken by looking at at eye level to the middle of the bottom layer of meniscus to reduce measuring errors that would affect the accuracy of my results.
SAFETY FOR BOTH PILOT EXPERIMENT AND MAIN INVESTIGATION
All chemicals and equipment should be used carefully and the whole experiment should be conducted with care. The points that must be followed when carrying out this experiment are:
- Safety goggles must be worn at all times to protect eyes.
- Handle all glassware with care.
- Tie hair back so that it does not catch fire
- Do not wear loose clothing so it does not set alight
-
After experiment is finished wash hands carefully and thoroughly.
- Clear away spillages immediately
- Keep bags / chairs tucked away
- Don't eat or drink near experiment
- Mercury in the thermometers is dangerous ad exposure to mercury can lead to health problems. Thus care must be taken when handling the thermometers so as to avoid breakage.
- Care must be taken when handling any hot equipment or water because if touched or spilled will scorch.
PREDICTION
I predict that as the substrate concentration increases, the time taken to collect 30cm3 of oxygen will decrease, and the rate of reaction will increase at a directly proportional rate. This will occur until the solution becomes saturated with the substrate hydrogen peroxide. When this occurs adding extra substrate will make no difference, however I do not believe I will reach saturation point, as I do not have a large enough range of concentrations.
I can predict this because as more substrate is added more of the active sites of the enzyme are being used, this results in a an increase of reactions which in turn result in a increase of oxygen production, therefore 30cm3 of oxygen is collected faster so there is a decrease in the time taken to collect 30cm3 of oxygen and as a consequence in the end the rate of reaction also increases. However when the amount of substrate molecules added exceeds the number of active sites available of the enzyme then the rate of reaction will no longer increase, but remain the same. This is because all the active sites are being used and the maximum number of reactions are being done at once, thus an any extra substrate molecules have to wait until the reactions finish and active sites become available.
I can predict that if I double the concentration of the substrate i.e. hydrogen peroxide the rate will double. This is because there are twice as many substrate molecules which can join onto the enzymes active sites, therefore the there are twice as many reactions and twice more oxygen is released so therefore 30cm3 of oxygen is collect twice as fast, therefore as a consequence the rate doubles.
PILOT
A pilot experiment, which is a preliminary experiment, is carried out in order for me to test my method and prediction, and to see if both are correct. If this is not the case I would make any necessary changes to my method and prediction before attempting my main experiment.
Apparatus List
- Unlimited supply of 10% hydrogen peroxide solution
- Unlimited supply of distilled water
- Unlimited supply of yeast solution
- Plastic ice cream tub or trough filled with water
-
Burette (measuring to 50cm3 and accurate to 0.05cm3)
- Funnel
- Boiling tube
- Bung with delivery tube and syringe needle
-
5ml/cm3 syringe (accurate to 0.2ml)
- 2x measuring cylinder (measuring to 50ml)
- Stand, boss and clamp
- Stop watch
- Heat resistant mat
- Test tube rack
- Safety goggles
Dilution table
Method
- Fill an ice cream tub ¾ full with tap water.
- Using a funnel fill a burette with the tap closed with tap water, then placing ones thumb over the burette opening place the burette upside down into the ice cream tub. Secure the burette in this position using a stand, boss and clamp making sure the bottom of the burette is 2 or 3 cm from the bottom of the ice cream tub.
- Using a 50ml measuring cylinder measure 5ml of hydrogen, then using a second 50ml measuring cylinder measure 20ml of water (for dilutions see dilution table above).
- Pour created dilution into boiling tube, and place boiling tube into test tube rack. Taking the bung with the delivery tube and syringe needle bung the boiling tube and place the delivery tube into the water bath so that the end is up inside the opening of the burette.
-
Using a class rod stir the yeast solution, and then using a 5cm3 syringe measure 2cm3 of yeast solution.
-
Now via the syringe needle squirt the 2cm3 of yeast solution into the boiling tube containing the hydrogen peroxide. Immediately after this has been done start the stopwatch. After 30cm3 of oxygen has been collected stop the stopwatch and record results.
- Carry out the experiment for all the substrate concentrations: 0% 2%, 4%, 6%, 8% and 10%, (for dilutions see dilution table above). The 0% hydrogen peroxide concentration is the control to show that at 0% concentration no reaction occurs.
Results Table
Modifications
I had to repeat my pilot two times; this is because I had to carry out two significant modifications. The first modification was to decrease the volume of yeast catalase used from 2cm3 to 1cm3. This was because when I carried out the experiment the yeast and hydrogen peroxide bubbled to such a great extent that they bubbled out of the boiling tube via the delivery tube and into the ice cream tub filled with water. After decreasing to volume of yeast catalase used to 1cm3 I preceded to carry out my pilot again, however when I reached the higher concentration once again the yeast and hydrogen peroxide bubbled to such a great extent that they bubbled out of the boiling tube via the delivery tube and into the ice cream tub filled with water. Thus yet again I was forced to decrease the volume of yeast catalase used this time from 1cm3 to 0.5cm3, and as a consequence I changed the 5cm3 syringe I was using to measure the volume of yeast to a 1cm3 syringe. This is because for a small volume such as 0.5cm a 1cm3 syringe is more appropriate and accurate. After the second and last modification my pilot was conducted successfully and I obtained the above results.
One the following two pages are graphs plotted from the results (time taken for 30cm3 of oxygen to be collected) and further calculations (rate of reaction) shown in the table above.
Analysis Of Pilot
From the graphs I plotted from the results (time taken for 30cm3 of oxygen to be collected) and further calculations (rate of reaction) I can see that my prediction is correct. This is because as the substrate concentration increases the time taken to collect 30cm3 of oxygen gas decreases and the rate of reaction increases. This is because for 2% the time taken to collect 30cm3 of oxygen is 160 seconds, and the rate of reaction in 0.2cm3/second. Then when the concentration increases by 2% to 4% the time taken to collect 30cm3 oxygen decreases to 77seconds and the rate for reaction increase to 0.4cm3/second. When the concentration further increases to 6% the time taken to collect 30cm3 of gas further decrease to 50 seconds and the rate of reaction further increases to 0.6cm3/second. As the substrate concentration increases to 2% and 10% the time to collect 30cm3 of oxygen yet again decreases to 45 and 38 seconds, and the rate of reaction yet again increases to 0.7 cm3/second and 0.8cm3/second. In conclusion my pilot gives my accurate, valid and theoretically correct results that support and prove my prediction is correct. This also means that the method for my investigation after the two modifications is correct.
MAIN INVESTIGATION
Apparatus List
- Unlimited supply of 10% hydrogen peroxide solution – to act as the substrate
- Unlimited supply of distilled water – used to dilute the 10% hydrogen peroxide
- Unlimited supply of yeast solution – this is a fungi which produces the enzyme catalyse
- Plastic ice cream tub or trough filled with water
-
Burette (measuring to 50cm3) –used to hold water and measure the volume of oxygen collected. A burette was used because it is extremely accurate to 0.05cm3 and can hold up to 50cm3 of liquid.
- Boiling tube – used to hold the yeast/catalase and hydrogen peroxide, it is where the reaction takes place
- Bung with delivery tube and syringe needle
-
1ml/cm3 syringe (accurate to 0.2ml) – this was used to measure the required volume of yeast
- 2x measuring cylinder (measuring to 50ml) – used to measure the correct volume water and 10% hydrogen peroxide solution
- Stand, boss and clamp – this was used to hold the burette securely in a vertical position.
- Stop watch – used to time the reaction
- Heat resistant mat – to protect the work surface, and for safety reasons
- Test tube rack – used to hold boiling tube and bung with delivery tube and syringe needle
- Safety goggles – to protect eyes
Dilution Table
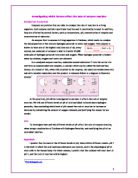
Diagram
Method
- Fill an ice cream tub ¾ full with tap water.
- With the tap closed fill a burette with tap water, and then placing ones thumb over the burette opening place the burette upside down into the ice cream tub. Secure the burette in this position using a stand, boss and clamp making sure the bottom of the burette is 2 or 3 cm from the bottom of the ice cream tub.
- Using a 50ml measuring cylinder measure 5ml of hydrogen, then using a second 50ml measuring cylinder measure 20ml of water. When measuring the volumes of hydrogen peroxide and water the measurement should be taken by looking at at eye level to the middle of the bottom layer of meniscus. This is done to reduce measuring errors and ensure a fair test.
- Pour created dilution into boiling tube, and place boiling tube into test tube rack. Taking the bung with the delivery tube and syringe needle bung the boiling tube and place the delivery tube into the water bath so that the end is up inside the opening of the burette.
-
Using a class rod stir the yeast solution to obtain a uniform solution, and then using a 1cm3 syringe measure 0.5cm3 of yeast solution, making sure there are no air bubbles in the syringe. This and measuring accurately is very important to accurately measure the amounts of yeast to ensure a fair test.
- Now via the syringe needle squirt the 0.5cm3 of yeast solution into the boiling tube containing the hydrogen peroxide, and immediately start the stopwatch.
-
Bubbles should start to rise up the burette and the water will be replaced by colourless gas oxygen. As soon as 30cm3 of oxygen has been collected stop the stopwatch and record the elapsed time down to the nearest 1/10th of a second.
- Repeat the experiment with hydrogen peroxide i.e. substrate concentrations of 4%, 6%, 8%, 10% and 0%. The 0% concentration of hydrogen peroxide solution is control to show that at 0% concentration no reaction occurs.
ANALYSIS
I processed all my results from the table (see previous page) into graphical form for the reason that graphs show the results both in numerical and picture form. Meaning that the general trend of the effect of substrate concentration on the rate of reaction can be shown.
For my further calculations I calculate the rate of reaction by dividing 30 by the average time taken to collect 30cm3 of oxygen. Using rate of reaction I plotted a graph of substrate (hydrogen peroxide concentration) on the x-axis against the rate of reaction on the y-axis. Just like I predicted in my prediction the graph shows that as the x-axis increases the y-axis also increase or in other words as the substrate concentration increases the rate of reaction also increases. I can see this because for 1% hydrogen peroxide the rate of reaction is 0.1cm3/second, then when the hydrogen peroxide concentration increases by 2% to 4% the rate of reaction also increase to 0.2 cm3/second. When the hydrogen peroxide concentration increases further to 6% the rate of reaction also increases to 0.6, and as the hydrogen peroxide concentration continue increasing to 0.8% and 0.10% the rate of reaction also increases to 0.8 and 0.10 cm3/second.
What I have stated in the previous paragraph is exactly what I predicted. I predict this because as the substrate concentration increases in reality more substrate is added and as a consequence more of the active sites of the enzyme catalyse are being used. This results in a an increase of reactions which in turn result in a increase of oxygen production, therefore 30cm3 of oxygen is collected faster and as a consequence the rate of reaction is also faster.
At 8% hydrogen peroxide the increase in the rate of reaction slows down, this is because the gradient of the graph begins decrease and the like I predicted the graph beings to curve. This is because at this the amount of substrate molecules added exceeds the number of active sites available of the enzyme. Therefore because all the active sites are being used the remaining substrate molecules must wait until the reactions finish and active sites become available. As a direct result the rate no longer increases, but remains the same and adding more substrate will not change this.
I can see that my quantative prediction which stated ‘that if I double the concentration of the substrate i.e. hydrogen peroxide the rate will double’ is correct. This is because when the 2% hydrogen peroxide is doubled to 4% the rate of reaction also doubles from 0.2cm3/second to 0.4cm3/second. Exactly the same occurs when the 4% hydrogen peroxide is doubled to 8% because the rate of reactions doubled from 0.4cm3/second to 0.8cm3/second. This occurs because there are twice the number of substrate molecules which can join onto the enzymes active sites. As a result there are twice as many reactions and twice more oxygen is released. Therefore 30cm3 of oxygen is collect twice as fast and as a consequence the rate doubles. What I have just explained is a limiting factor, and to sum everything up in is this experiment the limiting factor is the ’running out’ of the enzymes active sites.
EVALUATION
Overall I can quite confidently say that my investigation was a success. This is because the experiment was carried out well, no problems occurred and I obtained a good set of precise and thus reliable results, from which I could draw an accurate conclusion in my analysis.
I decided results were anomalous if the difference between a set of repeated results was any larger than 20 seconds. I chose such a small difference because I wanted my results to be as accurate as possible. Also I couldn’t really choose a smaller difference such as 10 or 5 seconds, this is because it would be very difficult to obtain sets of results that were 10 or 5 seconds within each other, and I would have to repeat the experiments a good many times.
I obtained 2 anomalous results during my investigation, which I highlighted in my results table and did not included in the average or any further calculations i.e. rate of reaction. The first anomalous result was 190 seconds for 2% hydrogen peroxide and the second anomalous result was 76 seconds for 6% hydrogen peroxide. Both results were anomalous because they were not within 20 seconds of the other results in the set. Instead 190 seconds for 2% hydrogen peroxide was anomalous by 5 seconds, and 76 seconds for 6% hydrogen peroxide was anomalous by 3 seconds. These anomalous results were obtained as a result of experimental errors or not controlling variables successfully.
To get rid of anomalous results the experiment would have to be repeated more than 3 times for each concentration of hydrogen peroxide. By repeating the experiment more times would also mean improving the overall result, this is because any errors in one experiment should be compensated for by the large number of repeated experiments from which one would calculate the average.
Except for the two anomalous results all the remaining results that I obtained were accurate and consistent, and I could confidently draw a reliable conclusion from them. I am confident of this for three reasons, the first reason is that I did three repeats for each hydrogen peroxide concentration, and then used the average of all the results to calculate the rate of reaction and plot a graph with a line of best fit. The second reason is that the results I obtained are theoretically correct; as were the graphs I plotted from them. The third and last reason is that the line of best fit on both my graphs runs through or right next to and touching all the plotted points, except one which it run close to but not touching.
The following are variables I was not able to control successfully:
(1)
I may have not kept the temperature the same throughout the whole course of the experiment. This is because due to lack of time I was forced to carry out the experiment over two lessons, in different labs and at different times of the day. This may have affected the temperature because the weather varied for warm to very cold during that weak. Also due to their positioning in the school one of the labs I worked in is cold the majority of the time, whereas the other one is warmer probably at room temperature.
This would have affected my results because for some sets of experiments the rate would have slightly increased because the temperature was higher, while in other sets of experiments the rate would have decreased because the temperature was lower. This occurs because with an increases of temperature the reactants gain more kinetic energy and are moving faster. As a result collisions are more frequent and hence more collisions are successful. Also at the same time collisions also more energetic, therefore more collisions have energy greater than the activation energy. So overall the reaction is faster and more product is produced in a certain amount of time. However at low temperature the opposite happens, the reactant particles move slower because they have less kinetic energy, therefore colliding less frequently and with little energy so fewer collisions have energy greater than the activation energy, hence the reaction is slow.
I believe that this was the larges source in my experiment and to reduce or eliminate it the boiling tube with the hydrogen peroxide and yeast in a water bath in which the water is kept at a constant temperature preferable room temperature.
(2)
As I stated earlier due to lack of time I was forced to carry out the experiment over two lessons, in different labs and at different times of the day. Not only did this not enable me to keep the temperature constant, but it also meant that I was unable to use the same batch of yeast for all the experiments.
This would have affected my results because different batch of yeast may vary slightly in concentration, and as a consequence the catalase will vary in concentration. This would lead to inaccuracies because in solutions of high concentration reactant particles are close together causing them to collide more frequently, hence the reaction is fast. Whereas in solutions of low concentration reactant particles are far apart so there are only infrequent reactions, therefore the reaction is slow.
I could control this variable more successfully by using the same batch of yeast throughout the whole experiment. I would do this by storing the yeast it a container labeled with my name so that I was able to use it the next lesson.
(3)
Due to human error I may have not kept the volume of enzyme constant during the whole investigation. This is because like in very experiment where measuring is concerned small measuring errors which I was unable to notice could have easily occurred, as I am only human. Measuring errors would have also occurred due to air bubbles in the syringe.
This would have affected my results only very slightly, this is because if the volume of enzyme increase there will be more active sites present for the substrate molecules and thus the rate will increase. On the other hand if the volume of enzyme decrease there will be less active sties present for the substrate molecules and the rate will decrease.
To improve this error I would either have to be more careful to ensure I am extremely accurate and that there are no air bubbles in the syringe. Or I could use a pipette.
(4)
The volume of oxygen to be collected quite easily was not kept exactly the same each time. This is because during the experiment bubbles of oxygen rise up the burette and replace the water in the burette. However this causes two problems, the first is that for the lower concentrations of hydrogen peroxide the bubbles rise extremely fast and it is difficult to stop exactly when 30cm3 is reached. The second error is that due to the air bubbles it is difficult to see when exactly 30cm3 has been reached and stop the stopwatch at this point. Also there might have been air bubbles already in the burette.
This would have an effect on the results because if the volume of gas collect was more then 30cm3, then one would calculate that the rate is faster than it actually was. While if less than 30cm3 of gas was collect one would calculate that the rate is slower than it actually was. Therefore both these errors would cause inaccuracies in the results, ad as a result the analysis and final conclusion reached.
I believe after temperature this was the second largest source of error in my experiment. This error could be improved or eliminated by using a gas syringe. This is because a gas syringe is more accurate than a burette, no water is involved only gas and thus the gas syringe movements are easy seen.
(5)
When measuring the volume of hydrogen peroxide and water the measurement I always took measurements by looking at at eye level to the middle of the bottom layer of meniscus in order to avoid inaccuracies. However it is not possible to avoid inaccuracies because I am only human and measuring cylinder are only accurate to 0.5ml or 1ml.
This would have effected my results slightly because will more hydrogen peroxide there would be an increase in concentration and thus a decrease in rate. While with more water there would be a decrease in concentration and as a result an increase in rate.
This error could be improved b using two separate burettes to measure the volumes of hydrogen peroxide and water required for the dilutions. This is because a burette is accurate to 0.05cm3 and can hold 50cm3 of liquid.
The following variables were controlled successfully:
(1)
During the whole experiment to reduce any possibility of measuring errors or other possible errors which would affect the accuracy of the final results I used the same apparatus. This is because different pieces of apparatus have different accuracies, therefore if I had changed apparatus some measurements and readings would have been more accurate or less accurate than others.
(2)
The pH was kept constant throughout the entire experiment because I did not ad either acid or alkali to the hydrogen peroxide and yeast mixture. The ph had to be kept constant because high ph (acidity) or low pH (alkalinity) results in a decrease of enzyme activity. Or if the ph is extremely low or high in a complete loss of enzyme activity, and therefore no reaction.
(3)
The same type of enzyme i.e. catalase was used throughout the whole course of the experiment. This had to be done because enzymes are substrate specific, and the enzyme catalase is specific to hydrogen peroxide. By this I mean the shape of catalases active site matches the shape of the hydrogen peroxide substrate molecule, and this enables the reaction to take place. Thus if any other enzyme such as Cymotripson or Acetylcholinsterase was used no reaction would occur because it’s active site would not match the shape of the hydrogen peroxide substrate molecule.
(4)
The enzyme i.e. yeast catalse concentration was also kept the same i.e. 10% throughout the whole experiment, this had to be done as an increase or decrease in concentration alters the rate of an enzyme-catalyzed reaction. This is because in solutions of high concentration reactant particles are close together causing them to collide more frequently, hence the reaction is fast. Whereas in solutions of low concentration reactant particles are far apart so there are only infrequent reactions, therefore the reaction is slow. Also before measuring 0.5cm3 of yeast using a 1cm3 syringe I will always stirred the yeast. This was is in order to achieve a uniform solution of equal concentration.
(5)
The source of the enzyme i.e. yeast catalse was kept the same during the whole experiment. This is because a different enzyme sources such as applies, potatoes and liver will produce different concentrations of enzyme. Also this introduces biological variation, by this I mean that although the same source is used the the catalase concentration will vary from apple to apple, potato to potato and liver to liver. This is because each apple, potatoes and liver is different.
Apart from controlling the variable unsuccessfully a number of other errors also occurred during the investigation. The first of these and in my opinion the third larges source of errors was that due to human error there was a slight delay between squirting the yeast into the hydrogen peroxide and starting the stopwatch. This would of slight affect all the results, however as I carried this out the same way for all the experiments then it should not make any difference to the overall result. This error could be improved by getting another person to start the stopwatch when the yeast is squirted into the boiling tube of hydrogen peroxide.
Even though the stopwatch shows times to the nearest 0.01 second due to the fairly slow speed of our reactions it is only possible to measure the time of the reaction to the nearest 0.1 second.
I only used 5 concentrations of hydrogen peroxide: 2, 4, 6, 8 and 10%. However using more concentrations would have enabled the maximum rate of reaction to be reached and as a consequence a better graph would have been yielded. The maximum rate is a point after which an increases in substrate concentration will not increase the rate of reaction. This is because all the enzymes actives sites is occupied by substrate, and added substrate molecules can't find any free enzyme to serve as a catalyst.
The table shows the spread of results for the results I obtained from my investigation. This spread of results occurs as a direct result of the errors and unsuccessfully controlled variables discussed above. Whenever there is a spread of results there are a range of places through which I could plot the best-fit line. However my spread of results is considerably small and the best fit line on my graph pass through all the plotted points. Therefore there is very small range where an alternate best fit line could have been plotted my graph, and nevertheless it would have made no difference to my results, the pattern of my results, any subsequent calculations or my final conclusion.
This experiment can be extended by investigating the same variable but using different enzyme sources i.e. apple, potato and liver. One could then compare the difference in the rate between the different enzyme sources.
Another extension would be to use a different enzyme and substrate, both would have to be changed as enzymes are substrate specific. One could then investigate whether using different enzyme and substrates alters the rate.
An alternate and more accurate method for investigating the effect substrate concentration has on the rate of an enzyme i.e. hydrogen peroxide catalysed reaction would be the experiment below. In this experiment the volume of gas formed is measured using a gas syringe rather than a burette. Also the boiling tube holding the yeast and hydrogen peroxide is in a water bath where the water temperature is room temperature, this is in order to keep the temperature constant.
Diagram
Method
- Fill an ice-cream tub half full with tap water and place it on a heat resistant mat also as to protect the work surface from spillages.
- Take a gas syringe and empty it of air, then place the delivery tube attached to the bung of a boiling tube into the opening of the gas syringe. This is done so that the oxygen i.e. gas produced during the experiment will be able to escape into the gas syringe.
-
Place the boiling tube into a water bath whose water temperature is at room temperature i.e. 37°C.
- Using a burette filled with hydrogen peroxide measure 5ml of hydrogen peroxide. Then using a second burette filled with water measuring 20ml of water. When measuring the volumes of hydrogen peroxide and water the measurement should be taken by looking at at eye level to the middle of the bottom layer of meniscus. This is done to reduce measuring errors and ensure a fair test.
- After removing the bung with delivery type and syringe needle pour created dilution into boiling tube. T
-
Using a class rod stir the yeast solution to obtain a uniform solution, and then using a 1cm3 syringe measure 0.5cm3 of yeast solution, making sure there are no air bubbles in the syringe. This and measuring accurately is very important to accurately measure the amounts of yeast to ensure a fair test.
-
Now via the syringe needle squirt the 2cm3 of yeast solution into the boiling tube containing the hydrogen peroxide, and immediately start the stopwatch.
-
Bubbles should start to rise up the tube and the gas syringe will move outwards, as soon as the gas syringe passes the 30cm3 mark stop the stopwatch and record the time to the nearest 1/10th of a second.
- Repeat the experiment with hydrogen peroxide i.e. substrate concentrations of 4%, 6%, 8%, 10% and 0%. The 0% concentration of hydrogen peroxide solution is control to show that at 0% concentration no reaction occurs.