Activity 23 suggests that we use a coloured light source and a lens with which we can focus the light onto a screen.
Activity 23 Apparatus Set-up (1)
As the object-lens distance (u) and the lens-image distance (v) i.e. the lens-screen distance were altered, some interesting things happened.
- The red and blue light are flipped vertically (upside-down). This can be explained through the use of a ray diagram as seen on Pg 2.
- The red and green light did not focus at the same points; therefore the focal length is dependant on the wavelength and/or frequency of the light.
-
When one of the coloured lights was focused, it wasn’t focused at a single point, but over a range of distances (u and v). This means that the focal length cannot be pinpointed. Instead, we get a mean for the focal length with some uncertainty/deviation.
- Because the light was in a shape of a circle, it was hard to distinguish a point where the dot was focused. A sharp-edged light source (e.g. a square) would have been more helpful as it would have been easier to see if the edges were in focus.
- The object-lens distance must be greater than the focal length of the lens; otherwise a magnification of the object occurs. This image can be projected but cannot be focused onto the screen (this image is known as a virtual image).
- However, this effect became useful, because we used another lens to magnify the image on the screen to see whether or not the image (dots) were in focus. (See third bullet point)
After doing the pre-test, the problems encountered can be rectified in the experiment proper.
Now all that is left is to make some measurements of u and v when the image on the screen is focused, put them into the lens equation and see whether or not the focal length is 20 cm.
The Method
- Gather the required equipment: A lens, paper (to act as a screen), a stand to hold the screen, a double light source (plus power pack).
- Align the light source, lens and screen. Then focus the image from the light source onto the screen for the red light. To ensure that the image is focused, use another lens to magnify the image that is on the screen.
-
Measure the distances for u and v and record the results.
- Repeat steps 2 & 3 for the green light.
The Safety (Issues)
Although this is a relatively safe experiment, some precautions should still be taken. If the experiment was to be carried out on the floor, then precautions must be taken to prevent people from tripping over the equipment.
Also, when supplying the lights with electricity from the power pack, it is better have a low voltage setting as this reduces the risk of the light source burning and the extremely unlikely possibility of setting the whole science block of fire!
The Results
(See Results Sheets)
The Analysis
The results show that the focal length of the lens is around 20 cm (200 mm). However, the (average) focal length is not exactly 200 mm, which suggests that either there is an error in the experiment or there is an error in the lens. More precisely, there is a possible error in the way the power of the lens was calculated by their manufacturer.
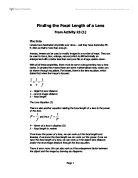
As I found out in the pre-test, different coloured light has different focal lengths. The speed of light in any specific medium is constant. As the wave equation says:
v – Velocity
ƒ – Frequency
λ – Wavelength
and the frequency of light didn’t change, or at least not a noticeable change (as the frequency of light determines its colour), only the wavelength of the rays changed could have changed as they went into the lens.
The focal length of the lens was longer when the red dot was focused that it was when the green dot was in focus (See “The Results” Section). This shows that the focal length is inversely proportional to the frequency of light used (as green light has a higher frequency that red light).
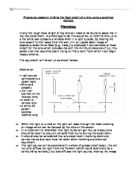
This also shows that the refractive index between any two materials is dependant of the frequency of light used. This can be shown if we simplify the shape of the lens used in the experiments. (4)
(NOTE: Diagram not necessarily to scale)
To begin with, the angle of incidence is the same with both rays. However the different light rays are refracted at different magnitudes and so the refractive index must be different for the two rays. Notice how the focal length are different, and this must have resulted from the theory that the refractive index is dependant of the frequency of light used because the same lens was used to focus the two different coloured dots.
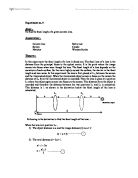
Moreover, the refractive index must be directly proportional to the frequency of light being used. This can be explained by the use of further diagrams.
(NOTE: Diagram not necessarily accurate or to scale, and parts are exaggerated for the purpose of emphasis)
As we saw earlier, the green light was bent more by the lens that the red light (and yes I know “bent” is a loose word, but it’s the best I can think of). This basically means that the angle of refraction, r, is smaller for the green light than it is fro the red light. Since Snell’s law states that:
if the angle of refraction, r, is decreased, the denominator (sin r) becomes smaller and therefore making the whole fraction bigger. This is true when green light is used instead of red, as the angle of refraction is smaller with green light than with red light (while the angle of incidence, i, is the same for both colours). This means that the green light has a bigger refractive index than the red light. In conclusion, the refractive index is directly proportional to the frequency of light used.
So, we have established that the refractive index and therefore, the focal length of a lens are dependant on the frequency/wavelength of the light used.
(Phew!)
In order for manufacturers of lens to measure the focal length of lens, they must have a standard frequency for which the focal length of a lens is measured with. From my results, the frequency used to measure the focal length is above the frequency of green light. As the lens used in the experiment was a 5D lens, the focal length must be 20 cm (200 mm).
My results show that the focal length decreases as the frequency of light increases (i.e. focal length is inversely proportional to the frequency of light used). They also show that the focal length of a 5D lens, when measured with red and green light, is more that 200 mm. This leads me to conclude that when the manufacturers measured the power of the lens, they must have used a light with a higher frequency than that of green light. Since the power of the lens is 5D, the focal length should be 200 mm, and the only way for the focal length to be 200 mm is to use a higher frequency light source.
The Evaluation
As mentioned earlier, having a shaped light source would have made the experiment a lot more accurate than they currently stand.
The Reference
(1) Salters Horners AS Advanced Physics
Unit 1 (Physics at Work, Rest and Play)
Section 3 (The Sound of Music)
Pg. № 159/160
Activity 23
(2) Salters Horners AS Advanced Physics
Unit 1 (Physics at Work, Rest and Play)
Section 3 (The Sound of Music)
Pg. № 159
(3) Salters Horners AS Advanced Physics
Unit 1 (Physics at Work, Rest and Play)
Section 3 (The Sound of Music)
Pg. № 161
(4) “The refractive index of a material varies with frequency (except in
vacuum, where all frequencies travel at the same speed, c).
http://www.wikipedia.org/wiki/Refractive_index
(about 11 paragraphs in. The above can be found on the paragraph
above the table)