But I do believe that there is one problem with gathering the data in this fashion, since every one in the class is using the same piece of wire for there experiment in time thought out the experiments the wire that I am using will ultimately degrade and will start to give flawed information, that will mean that people that do the experiment first are likely to have more actuate information than the last group.
To make sure that this is a fair and even test they are some things that most remain constant through out the experiment, for instance I must make sure that the gaps between each section off wire that I test are equal e.g. go up in tens or twenty’s not random numbers like 1, 15, 22… This will insure a fair test.
I predict that in this experiment that resistance will be proportional to length this should result in a straight-line graph, as a straight line is evidence of a correlation across the axis e.g. P.D is proportional to the resistance
Obtaining Evidence:
I plan to get evidence from this experiment by moving the wire with the crocodile clip on it up the wire that I am testing in stages of ten centimeters, at each stage I will read of the ammeter reading and the voltmeter reading for that particular voltage e.g. 2 then move on to the next 4 and so on, once I have collected all the information I will repeat this experiment again and then for a third so I have a wide range of results which I can cross match and analyze for any data matches or anomies.
Here is my first results table that I made as I did the experiment
Staple first tape here
Here is my revised table of results as the early one hand a number if errors present on it
From this I can conclude a number of things that directly supports my theory that length is proportional to resistance, for instance if we look at the resistance of a piece of wire 80 cm long which has a resistance of 4.2 and then of a piece 160 cm long which has a resistance of 9 we can see that there is all most a doubling effect going on, which will become apparent when I graph this data.
Analyzing the evidence:
From the evidence I can see that resistance goes hand in hand with length e.g. if you double the length you double the resistance this is clear from the table present,
From looking at the graph I can see that resistance is connection to length but this graph show us that there is a number of anomies that are possible errors or flawed data.
Changes:
If I were doing this again I would perhaps use a even longer piece of wire as this would in turn give me a much larger set of data and the more information I have the more accurate my results would be, other changes I would include putting a larger amount of current through it and use a thicker or different type of wire both these would gave me more throughout and accurate data.
Considering The Evidence / Conclusion
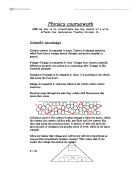
From the evidence we can see that as we increase the length of wire we also increase the resistance, this is due to electron flow, metals contain a “sea” of free electrons which are negatively charged and which flow throughout the metal, this allows electric current to flow though metals better than it does in non metals, but It should also be noted that electrons flow the opposite way to conventional current, we normally say that the current in a circuit flows from positive to negative alas electrons were discovered long after that it was decided that electrons were positively changed this theory turned out to be wrong and it was later discovered that there were negatively changed this means they actually flow from -ve to + ve opposite to conversional current.
This is how resistance occurs, as the free electrons move to the positively changed side of the power supply their move around and past the atoms of the metal occasionally the free electrons collide with the atoms thus producing resistance. But the longer the material is or the thicker the material is the longer it will take for the electrons to pass from one end of the metal to the other, this is what has taken place in this experiment as I increased the length the resistance all so increased meaning that resistance does have a fundamental link with length and or thickness, this is clearly proven with the graphs and charts above. A diagram of electron flow is below.