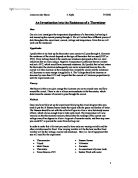
Diagram
This scientific diagram shows how we set up our equipment.
Fair Testing
To ensure that this experiment will be unbiased we will use the same equipment throughout the whole test, the same volume of water and only vary two factors; the temperature and the number of batteries in the circuit. We will vary the number of batteries in the circuit because we want to increase the accuracy as testing with only one battery repeatedly will show the same result and may be faulty. Whereas, using different numbers of batteries will show a pattern and if there is a fault it will be easily spotted. We will raise the temperature in exactly five degree intervals so we can see how the resistance varies steadily. Also, it would be harder to take or evaluate the results if there are random or larger intervals.
Obtaining Evidence
Results
The key:
- V1 = the voltage reading with one battery.
- V2 = the voltage reading with two batteries.
- V3 = the voltage reading with three batteries.
- I 1 = the amp reading with one battery.
- I 2 = the amp reading with two batteries.
- I 3 = the amp reading with three batteries.
- R1 = the resistance with one battery.
- R2 = the resistance with two batteries.
- R3 = the resistance with three batteries.
- R average = the average resistance for this temperature.
These results were directly obtained from the voltmeter and the ammeter. We can produce a series of graphs for these results but I have decided to show two graphs; one with all the voltmeter readings for each temperature and another with all the ammeter readings for each temperature.
We can now use a formula to find the resistance for each minor test. The formula is:
Potential Difference ÷ Current = Resistance or R=V÷I
Using the resistance results we can now calculate the average resistance for each temperature. To do this we will use this formula:
(R1+R2+R3)÷3
We can represent this information in a final line graph
Scientific Knowledge
Scientific Equations
I found all my formulae for calculating the resistance from the Letts’ GCSE Physics Revision book page 60, and in a physics textbook called Complete Physics by Stephen Pople. Both books state that the way to calculate the resistance is to use the following formula triangle and substitute in my specific calculations:
Thermistor
In the Letts’ “Double Award Science Physics Higher” GCSE Revision guide page 61, it states, “Thermistors are resistors whose resistance alters greatly as their temperature changes. Unlike wires, in the vast majority of these resistors have resistances that decrease as their temperature increases.”
The information on the DK GCSE Physics for PC and CD-rom reads thus “A thermistor is made from a semiconductor material. At a lower temperature fewer electrons are available to take part in conduction. As the material is heated more electrons are freed from atoms and are available to take part in conduction. As a consequence the resistance decreases.”
This information about the thermistor helped me decide on my prediction
Analysing Evidence
The primary current readings graph shows that as the temperature rises so does the flow of current. With one battery in the circuit the current rises steadily with the temperature. With two batteries the current rises faster and with three batteries it rises faster still.
The primary voltage readings graph shows that as the temperature rises the potential difference stays approximately the same; with one battery in the circuit the voltage stays at 1.6V for the three lower temperature readings and then drops 0.1 volts, it remains there as the temperature readings rise. With two batteries the voltage fluctuates as the temperature rises, only decreasing 0.2 volts. With three batteries in the circuit the voltage fluctuates as the temperature rises. It fluctuates around the point 4.5 volts, with the greatest decrease of 0.2 volts and the largest increase of 0.2 volts.
The scientific knowledge from the DK GCSE Physics (PC CD-ROM) shows that as the temperature rises, more electrons are freed thus the current rises; this has been illustrated on the primary current readings graph, this information is also part of my prediction.
The fluctuations in the potential difference seem irregular and suspicious but I have no scientific proof as to how the potential difference should be. Therefore, it may or may not be correct.
On the final graph which shows the average resistance for each temperature, it can be seen that as the temperature increases the potential difference decreases, as I predicted based on my scientific knowledge of thermistors.
Evaluation
Results
The primary current readings graph shows that the current rises as the temperature rises, this is what I expected.
However, the results on the primary voltage readings graph fluctuate as the temperature rises. I did not know what to expect with these results as I had no other results to compare it with and no scientific knowledge as to how the potential difference should appear.
The average resistance for each temperature graph summarises all of the results and this shows that the resistance decreases as the temperature rises, This is what I predicted and so these results were what I expected.
Improvement
To improve this report I could have taken more readings in the same test; with more temperature readings and/ or more batteries. This would have increased the accuracy of the results but it could have been too time consuming. I could have done the same tests but repeated them with different equipment and compare the results. This would show if the equipment was faulty and if it was not it would show more results, thus increasing accuracy. Again this would be too time consuming. I found that a flaw in my report was that I did not have any scientific evidence as to how the potential difference should be. To improve my report further research is required, which will increase my understanding of what the results should be like.
PHYSICS COURSEWORK JULY 2003