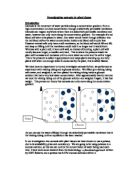
This diagram shows how sucrose affects the concentration gradient of water.
Plan:
I plan to find the water potential of a chip, by testing it with different concentrations of sucrose solution to test whether the potato will shrink when a stronger sucrose solution is acting upon it, firstly I will mix sucrose with water to form a sucrose solution, then I will measure out the correct solutions to the petri dishes which I had pre-labeled 0.0 for pure water 0.2, 0.4, 0.8 and 1.0 for pure sucrose, this is when the water is completely saturated and can hold no more sugar.
Afterwards, I cut up 10 chips to the measurement of 40 millemetres in length and immersed two in each of the petri-dishes containing the different concentrations of sucrose soulution.
Aim:
My aim in this experiment is to find the water potential of a chip and to test test the theory of osmosis to see if I can produce accurate results and have an accurate prediction .
Safety rules:
Although this is a safe experiment and spills would be harmless, like any experiments there are still safety aspects to take into account these include taking care when cutting the chips and wearing safety goggles just in case anything may go into ones eyes. So to be safe in this experiment I am going to take extra care when I cut the chips and wear safety goggles just in case.
Results
The length change for 1 and 2 is the two chips inside the petri-dish, the first table is for half an hour and the second is for 24 hours, the results are on the next page.
The change of length of this is done as mean length minus original length.
Table for 30 minutes:
Concentration Start length1 length2 mean length change in length
0.0 40 mm 45mm 44mm 44.5 4.5mm
0.2 40 mm 45mm 44mm 44.5 4.5mm
0.4 40mm 43mm 43mm 43 3mm
0.6 40 mm 39mm 41mm 40 nil
1.0 40 mm 39mm 38mm 38.5 1.5mm
Table for 24 hours:
Concentration Start Length1 Length2 Mean length Change in length
0.0 40mm 57mm 56mm 56.5mm 16.5mm
0.2 40mm 55mm 55mm 55mm 15mm
0.4 40mm 54mm 54mm 54mm 14mm
0.8 40mm 51mm 49mm 50mm 10mm
1.0 40mm 49mm 49mm 49mm 9mm
Table showing substance concentration:
conc/mol water/cm2 Sucrose 1 mol solution
1.0 0 30.00
0.8 6 24.00
0.4 12 18.00
0.2 24 6.00
0.0 30 0
conclusion:
In this experiment my prediction was correct and I am satisfied that this experiment was carried out faierly concluding that thuis was a fair test, there is a few observations which i could have done to aid the accuracy of this experiment, e.g. the concentration of the sucrose in water went as follows, 0.0, 0.2, 0.4, 0.8 and 1.0 to aid the accuracy i could have added 0.6 in between 0.6, this is not that importanty though as the results show it is fairly accurate what has happened to the cells is shown in the following diagrams
These two diagrams show a deplasmalized cell and a turgid cell.
The dseplazmalizeds is beforer osmosis and the turgid cell is after osmosis.