D=h
FP
Diagram 4
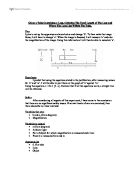
Now look at the diagram on the next page. If a paraxial ray from O is incident on the lens at distance h from the axis, it must also suffer deviation (D). Since all rays suffer the same amount of deviation. In the triangle IOM, the exterior angle of a triangle equals the sum of the interior opposite angles.
Converging Diverging
D=α+β D=α-β
D=h h D=h h
OP IP IP OP
Therefore
FP OP IP FP IP OP
The above formula explains how we get;
1 1 1 where u=object distance
v u f f=image distance
v=focal length
Diagram 5
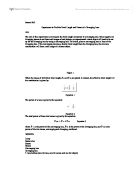
Magnification is defined as:
magnification (m) = image height
object height
and image height image distance
object height object distance
magnification = v u=object distance from lens.
u v=image distance from lens
Prediction
From all my preliminary work, which was done on an applet at school, I predict that as the object moves towards the lens, the image becomes farther away (from the lens) therefore the magnification will increase.
Variables
In my experiment there are three key variables, which are:
Object distance, which is the independent variable. Control variables are the variables that are changed. I will change the object distance of the lens.
Image distance, which is the dependent variable. The dependent variable is the data collected, so in this experiment it will be the image distance.
Focal length, which is the control variable. Control variables are the factors, which help to keep the experiment a fair test. In this experiment the control variable is the focal length.
Safety Precautions
To protect myself from any danger a few tasks have to be done.
-
Be careful with the power pack the ray box is connected with.
-
Do not hold the light bulb since it gets very hot.
-
Do not shine the light in your eyes or anyone else’s.
-
Do not break your lens.
Fair Test
To make sure the experiment is fair a few factors have to be taken into consideration.
To make it a fair test then I will use the same ray box, same metre ruler, same slide, same lens and the same screen.
To make the experiment accurate and to prevent anomalies I will repeat the whole experiment at least three times and take an average reading.
Equipment
Lens
Screen
Ray box
Slide
Metre Ruler
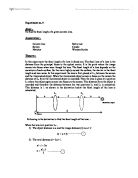
Method
- Set up the diagram as shown below.
- Move the object closer to the lens and measure the image distance as well as the object distance.
- Calculate the magnification.
- Repeat step 2 several times and repeat the experiment three more times and take an average reading.
Diagram
Preliminary work
My preliminary work was done using a java applet that can be found on the following website:
My results are shown below.
Actual Experiment results.
Measurements have been converted to metres.
U is the object distance – independent variable.
V is the image distance – dependent variable.
Plot (1/u) along the x-axis.
Plot (1/v) along the y-axis.
Graph See graph paper.
Ex = E 1/u = 42.491
Ey = E 1/v = 23.324
Ex2 = E (1/u) 2 = 192.55
Ey2 = E (1/v) 2 = 67.353
Exy = E (1/u×1/v) = 86.694
x =Ex/n
=42.491/10
=4.2491
y = Ey/n
= 23.324/10
= 2.3324
Sxx =Ex2 – nx2
=192.55-10×4.24912
=12.0015
Syy = Ey2 – ny2
=67.353-10×2.33242
=12.9510
Sxy = Exy-nxy
=86.694-10×4.2491×2.3324
=-12.4120
Least Squares Fitting
Gradient = β =Sxy/Sxx
=-12.4120/12.0015
=-1.0342
Formula for line of best fit.
(y-y) = β(x-x)
y=βx+y-βx
Intercept =y-βx
=2.3324-(-1.0342×4.2491)
=6.7268
Therefore, y=-1.0342x + 6.7268
Since y=1/v x=1/u
1/v= -1. 0342/u + 6.7268
1/f = 6.7248
f = 0.14865m
Analysis
The first two points are left out, as it was impossible to accurately locate the image. I will do a least squares analysis on the remaining points.
The object distance against magnification graph forms a curve. This curve represents exactly what I had predicted that the nearer the object is to the lens the better the magnification.
The graph that shows the relationship between 1/u and 1/v shows a negative correlation of points and this means that as the object distance decreases the image distance increases.
I had one difficulty when doing the experiment and that was the judgment in measuring the distance from the lens to the image (1 cm error) and from the object to the lens (0.5 cm error).
Theoretically the best magnification should be when the object distance is nearest to the lens but before the focal point. This is represented in the experimental results above.
Evaluation
I think my plan worked out because I got the results I expected to get.
My results for my experiment are quite accurate and reliable but there is a marginal error. My experiment could be improved if I used a tape measure instead of a ruler because there was a marginal error in measuring the object distance and image distance.
The first two points were anomalous.
I think that if I did the experiment again I could change the focal length.