Thaddeus Cheung (4534) Physics Coursework – Solar Cell
What affects the voltage output of a solar panel?
Planning
Aim
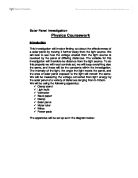
The aim of the investigation is to find out how the distance between a light point source and a photovoltaic cell affects the output potential difference.
Hypothesis
I predict that the further the distance, the smaller the output potential distance
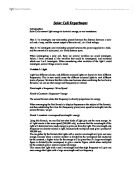
Inverse square law for light intensity
(Taken from the website - http://hyperphysics.phy-astr.gsu.edu/hbase/vision/isql.html#c1)
“Inverse square law for light intensity against distance: As the distance between an observer and a light source increases, the observable brightness decreases with d-2. Light spreads out over an increasing area of space to decrease apparent brightness. (Figure 1.1)
Figure 1.1 (http://www.astrosociety.org/education/publications/tnl/32/images/fig5.gif)
Because, Pin is proportional to area-1 and area is proportional to distance2, therefore Pin is proportional to distance-2 (figure 1.2). This supports my prediction that the output potential difference will be much smaller when the distance between the point source and the PV cell increases. Of course, my hypothesis assumes 100% efficiency and no influence from background light and other factors that may affect the experiment in anyway.
1.2 Prediction of outcome (Pin α distance-2)
Apparatus list
The list of apparatus to be used is:
A ray box is chosen over a light bulb as the light bulb will emit light out of all directions, while the ray box’s light can be controlled to be emitted out through one direction, to the solar cell.
Method
- Gather all the equipment
- Measure the radius of the light bulb using vernier callipers and add it to the distance between the light bulb and the end of the ray box.
- Plug in the power pack and connect it to the ray box
- Tape the black paper on the table, with an inch going underneath the ray box
- Use the length measured from step 2 to find 10cm away from the point source and mark it on the black paper.
- Mark 5cm increments from the base(10cm) mark until you get to 60cm
- Attach the solar cell to the clamp and clamp it on the table with the first marker. Use a set square to make sure that the solar cell is 90° to the table.
- Turn on the voltmeter and note down the volt output without the ray box on. This is the background reading
- Switch on the power pack and take the reading from the voltmeter. Subtract the background reading from this current reading
- Turn off the power pack and repeat steps 8 and 9 two more times to get an average
- Do steps 7-10 increasing the distance by 5cm (next marking) until the solar cell is 60cm away from the point source

This is a preview of the whole essay
Peer Reviews
Here's what a star student thought of this essay
Quality of writing
Their quality of written communication is generally good, and they have made very few spelling or grammatical errors. The report appears to be very well presented, and they have made good use of graphs and tables to present their results clearly. However, the layout is not perfect - the author has first describes a suitable method, but then does a preliminary experiment which should have been used to come up with this method in the first place. They have also not stated that this is a preliminary experiment, but treated it as if it was the real experiment, except that it doesn’t follow the proposed method. They then have suggested improvements to the experiment that they didn’t actually do based upon the preliminary. I would have described roughly the plan of the actually experiment, without giving any precise lengths or other measurements, then done a preliminary, explaining that this is to work out the most suitable lengths and other measurements to be used. The preliminary should have tested more than three points – I would have recorded the voltage every 10cm until there is no longer any significant change between readings, then plotted all these points on a graph, not just three, which would show the point where the change in distance no longer affects the readings. This would be more useful and make it clearer to the reader what you are doing. Only after these steps would I propose a clear method. This more chronological approach is more conventional and makes it clearer to the reader what you are doing. Another small issue is that they have not clearly labelled their graphs with the units, clear headings, and a description of what the graphs actually is. This makes it slightly confusing to the reader. I would also have used standard units throughout, which makes it much easier to do calculations, as well as being more conventional. Although they have given good headings throughout the report, one stands out as being ‘a bit GCSE’ – “Fair testing†– at A level, we are advised to say ‘reducing uncertainties’ instead. They have also used the word ‘rogue’ instead of ‘anomalous’, which is rather odd, and they have not been able to calculate anomalies as they have not repeated their experiment enough – this can only be done when it has been repeated at least 5 times. However, they have presented their work well, have good spelling and grammar, have used tables and graphs to make their results clearer to the reader, and have shown most of their workings, so the occasional slip in convention could be overlooked.
Level of analysis
The author has analysed their results well and compared then to his original hypothesis, using this to come to a well-justified conclusion. However, occasionally they have made minor errors in their analysis, for example they say: “Metre ruler [uncertainty]: +/- .1cm†– we were advised that the uncertainty in a measurement is +/- half the smallest measurable value, so in this case +/- .05cm, because the smallest measureable value is 1mm. However, it’s always better to overestimate rather than underestimate uncertainties so they may not have lost too many marks. I would also have calculated the uncertainties at all the points and plotted uncertainty bars on the graph, which would clearly show how large or small the uncertainties are compared to the values measured (although they have calculated the percentage uncertainties, it is much easier to visualise when they are plotted on a graph with the original data). I would also have plotted one graph with all the recorded data on it, which would show the spread of the data clearly, rather than only using the mean values. I would also have plotted graphs using the original data, rather than only plotting 1/d2 against the voltage output, which would allow more exploration of the relationship between the two. I would also have plotted a line of best fit (excel/ autograph can calculate these and give you its equation, which is really useful, otherwise you could use a more mathematical approach using logarithms. Some exam boards require you to plot them yourself using a pencil, so check with your teacher beforehand!). However, they have used their graphs well to discuss the relationship between the distance and the voltage output, so should have gained good marks for their use of graphs. Another, slightly more important suggestion for improvement is in the scientific explanations given. Their reasoning of the original hypothesis is excellent, however they show at times a lack of understanding about the solar cell, for example, while explaining why “The graph starts to level off as the distances increases†the author claims that this is due to the solar cell being saturated with light, when less light would be reaching the solar cell as the distance increases, so in fact the opposite is true - as the distance increases, the number of photons reaching the solar cell decreases, so less electrons are forced around the circuit. The graph levels off as the distance reaches a limit when the radiation emitted by the light source is not significantly different from the level of background radiation – the ‘noise’ is hiding the signal. To be able to continue the experiment beyond this point, a brighter bulb would have to be used throughout the experiment. Proof reading the report and really thinking about what is happening within the solar cell should help resolve these issues. Despite these mistakes, the author has analysed their results well, using them to come to a good conclusion. They have discussed the causes of uncertainties, and used this to discuss improvements, and explored the relationship between the distance and the voltage produced, showing a good level of analysis.
Response to question
The author has responded well to the task, by developing a suitable experiment to measure how the voltage output from a solar cell is affected by the distance away from a light source it is. They have made a well reasoned hypothesis and confirmed it by analysing their results, using this to come to a well justified conclusion. The question was given as “What affects the voltage output of a solar panel?“, so perhaps they could have also investigated, or at least mentioned, other things which may have an effect, such as the intensity of the light. However, their experiment was clearly carried out very well, and overall their response to the question is very good.