Solution: To solve the problem my programme of events must it be clear and easy to use. I will design the programme of events on Microsoft Word because it is a word program so it is easy to add and remove text also pictures and images. Another program that can be used is Microsoft Publisher. It might actually be easier to design the programme of events on publisher because Microsoft Publisher was designed for these kinds of tasks.
Task 2 Recording Sheets
This is the second task and in this task I must design a form of search and two sample-recording sheets for two separate sports activities.
Problem: There are three minor projects that make up this task. The first is to design two sample-recording sheets on two separate sports.
The second is to design some form of a search to make it easier for the school find the names and details of the students they need.
The third project is to type instructions for the school. The instructions should help the school to design their recording sheets and also to edit their search if necessary.
Solution: To solve this problem I must firstly design the recording sheets based on the instructions given, it must be large, clear and easy to use. I will design the recording sheets on Microsoft Word because the problem is mainly about text and tables so it should be appropriate.
The second problem is to design some for or search to go through the huge list of names and details. My first choice will to use Microsoft Excel because of its filtration program but it takes long to achieve your final result and the layout might be untidy. The second option I would pursue is Microsoft Access, I could design a database using the list of names given and then I could create a query. It's a lot faster than the filtration in Microsoft Access and the layout is a lot better.
The third task is to design instructions. I simply need to go through the stages for designing the recording sheets and database in detail so the user will understand.
Task 3 Performance Charts
This is the third task, in this task I must create a performance chart (graph) on the points awarded in certain events.
Problem: The problem is to design a performance chart which the school wants to put on the walls of the sports hall. The performance chart should compare the total points gained by each house in one event.
On the same chart it should show how many points the boys gained and how many points the girls gained in each house. The girls and boys results must be displayed in different colour with a key to show what is what.
The title for the performance chart is Results for 100m and the axis should be labelled House and Points awarded.
Solution: I must make the performance chart easy to read and understand, with clear numbers showing the results. I will design the graph on Microsoft Excel because one of the many functions of Excel is graphs. I could use Microsoft Word but Excel is a program that deals mainly in numbers as Word deals mainly in text.
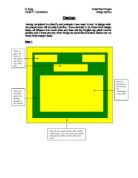
Task 4 Sports Day Web Pages
This is the forth task, in this task I must design four web pages giving information on the sports day and events.
Problem: The problem is to design a title web page with hyperlinks to three sub-pages. On the three sub-pages there should be hyperlinks to the title page only. The hyperlinks must be in form forms (i) a small version of the school crest (ii) in the form of text.
The first page is the Sports Day Page and will be the title page. At the top of the page will be the school crest and underneath that the heading Sports Day. On separate lines under the heading will be three hyperlinks. The first links the user to the Information Page, the second to the Reasons to take part in sports day page and the third to the sports day records page.
On the Information page the heading should be Information and under the heading must be information on the day.
On the reasons to take part page there should be the heading Reasons to take part in sports day and underneath that a list of reasons why should take part in the day.
On the sports day records page there must be the heading Records set in 2001 and then should list the record breakers results in 2001.
Solution: To solve the problem I make sure that the web pages are clear and user friendly. I should make sure the links are in perfect working order. To design the web pages I must use Microsoft Front Page, this program is specifically designed for web pages. There are other programs, but I have had more experience using Front Page.
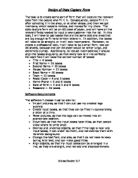
Task 5 Holly Grove Price Pledge
This is the fifth and final task, in this task I must produce a model to show the school how much money they need to pay for the sports day.
Problem: The problem is to produce a model that the school can use to predict what are the best prices they should charge for the hot and cold drinks on the sports day. The school does want to make an excessive profit, but it doesn't want to make a loss.
The pledge states that hot drinks will be either 55p or 60p and that the cost of a cold drink will not be more than 60p. The drinks have to cover the cost of the day. These are the cost of printing the programmes (£175), the hire of the public address system (£110) and the overtime for the caretaker (£27.50). However the school receives (£80) from the sports day sponsors and (£50) from the ice cream van selling sweets and ice cream but not drinks. The costs to the school to make the drinks are 15p for a hot drink and 25p for a cold drink. The model must consist of results for five weather conditions; hot day, warm day, mild day, cool day and cold day.
Solution: I will design several table in Excel each table will have the results for all five weather conditions. I will design several because the others can be used in my testing plan. The best of this tables I will choose and then design a bigger and clear table in Microsoft Word.